
On Thursday, the USD/CAD currency pair pulled back from the session highs of about 1.4411 to trade at about 1.4354. The currency pair also completed a downward breakout from an ascending channel formation.
As a result, the currency pair has fallen below the 100-hour moving average line. Thursday’s pullback also pushed the pair closer to the oversold levels of the 14-hour RSI.
USD/CAD Fundamentals Overview

From a fundamental perspective, the USD/CAD currency pair trades during a relatively busy period in both markets. On Thursday, the U.S. initial jobless claims for the week ending January 17 missed the expected claim count of 220k with a slightly higher tally of 223k, up from the preceding week’s equivalent of 217k.
The continuing claims for the week ending January 10 also came in higher than expected with 1.899 million versus a forecast of 1.86 million, up from the preceding week’s equivalent of 1.853 million.
In Canada, the retail sales for November missed the expected (MoM) change of 0.2% with a change of 0%. The retail sales ex-autos also fell short of 0.1% with a change of -0.7% (MoM). Canada’s consumer price index for December missed the expectation of 1.9% with a rate of 1.8% (YoY), while the (MoM) equivalent was in line with the estimate of -0.4%.
The BoC’s core consumer price index for the period improved to 1.8% from 1.6% (YoY), while the (MoM) equivalent declined to -0.3% from -0.1% in the preceding month.
USD/CAD Technical Analysis (the 60-min Chart)
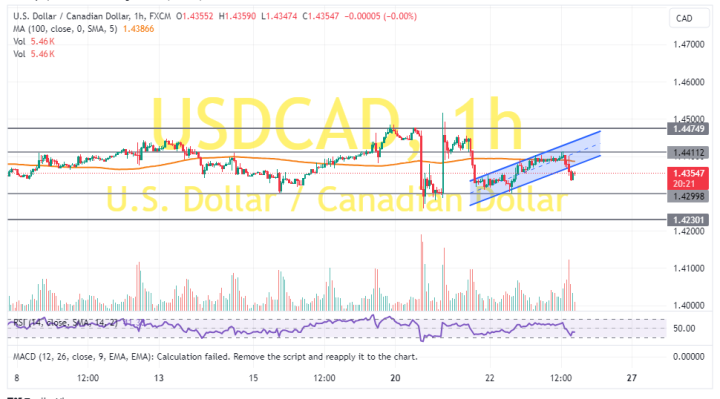
Technically, the USD/CAD currency pair has completed a downward breakout from an ascending channel formation. The 14-hour RSI has also fallen closer to the oversold levels of the indicator.
Therefore, the bears will look to stretch the current pullback towards 1.4299 or lower to 1.4230. On the other hand, the bulls will look to pounce on profits at about 1.4411 or higher at 1.4475.
USD/CAD Technical Analysis (the Daily Chart)
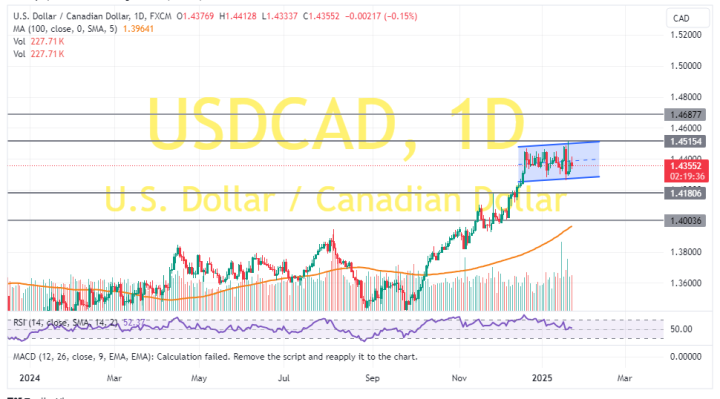
In the daily chart, the USD/CAD currency pair trades within a highly volatile sideways channel formation. The 14-day RSI has recently pulled back to avoid rallying into the overbought conditions.
Therefore, the bears will look to extend the current pullback towards 1.4180 or lower to 1.4003. On the other hand, the bulls will look to pounce on profits at about 1.4515 or higher at 1.4687.