
On Thursday, the USD/CAD currency pair pulled further back to trade at about 1.4105, down from Wednesday’s highs of about 1.4138. The currency pair trades within an ascending channel formation in the 60-minute chart.
The pair continues to trade slightly above the 100-hour moving average line, despite the pullback. The currency pair still has room left to run before reaching the oversold levels of the 14-hour RSI.
USD/CAD Fundamentals Overview

From a fundamental perspective, the USD/CAD currency pair trades during a relatively busy period in both markets. On Thursday, Canada’s seasonally-adjusted Ivey Purchasing Managers’ Index for October missed the expectation of 55.2, with a reading of 52.4, down from the previous month’s equivalent of 59.8. Earlier in the week, the S&P Global Manufacturing PMI for October came in at 49.6. Traders will be looking forward to the Canadian employment data for October on Friday.
In the U.S., the ISM Services PMI for October outperformed the expectation of 50.8, with a reading of 52.4, up from the previous month’s equivalent of 50. The S&P Global Composite PMI for the period fell short of the forecasted reading of 54.8, with a reading of 54.6. On the other hand, the ADP employment change for October increased to 42k, up from -29k in September, beating the forecast of 25k.
Earlier in the week, the ISM Manufacturing PMI for October missed the expectation of 49.5, with a reading of 48.7, while the ISM Manufacturing Prices Paid for the period fell short of 61.7, with a reading of 58.
USD/CAD Technical Analysis (the 60-min Chart)
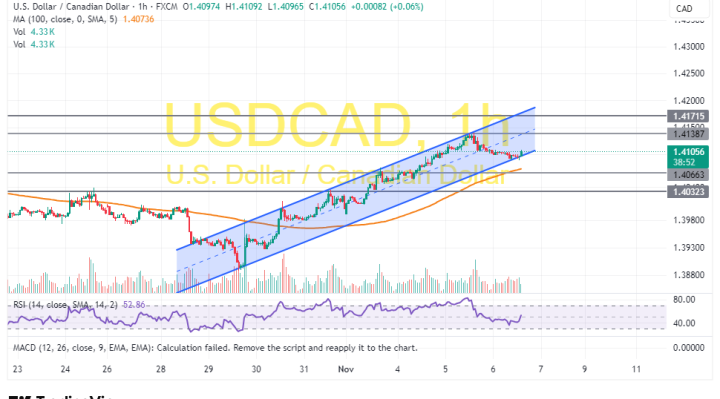
Technically, the USD/CAD currency pair trades within an ascending channel formation in the 60-minute chart. However, the 14-hour RSI has recently pulled back to recover from overbought conditions.
Therefore, the bears will look to stretch the latest pullback towards 1.4066 or lower to 1.4032. On the other hand, the bulls will look to pounce on rebounds at about 1.4138 or higher at 1.4171.
USD/CAD Technical Analysis (the Daily Chart)
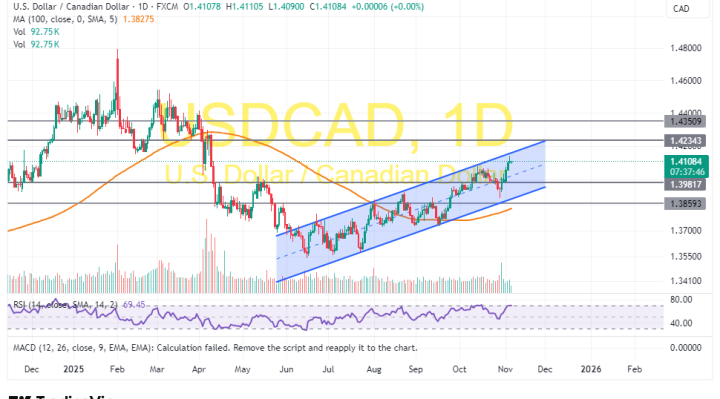
In the daily chart, the USD/CAD currency pair trades within an ascending channel formation. The 14-day RSI also supports a long-term bullish bias as it edges closer to overbought conditions.
Therefore, the bulls will look to ride the current run of gains toward 1.4234 or higher to 1.4351. On the other hand, the bears will look to pounce on pullbacks at about 1.3981 or lower at 1.3859.