
The USD/CAD currency pair posted successive gains during the week but failed to break through the key resistance zone around the 1.3500 level. The pair only managed to edger high above this level momentarily to trade at 1.3546 before pulling back to end the day dead flat at 1.3500.
The USD/CAD currency pair has been on a sideways movement dating back to mid-April and this patter appears set to continue to the end of the week. Notably, the pair did manage to new monthly highs of 1.3546 during the week.
USD/CAD Fundamentals Overview

From a fundamental perspective, the USD/CAD currency pair’s next move inches on the upcoming economic data from both the US and Canada. Friday will be a big day for the loonie as investors await Q1 GDP for the Canadian economy.
Current expectations are that an Okay GDP will be good enough to strengthen the CAD, which in turn could trigger the expected pullback in the USD/CAD pair.
On the other hand, while there isn’t much to look forward to that could significantly strengthen the USD on Friday, the greenback will be looking forward to a busy period next week with the NFPs on the way. The US Q1 GDP growth was revised lower to a solid 3.1%.
USD/CAD Technical Analysis (the 240-min Chart)
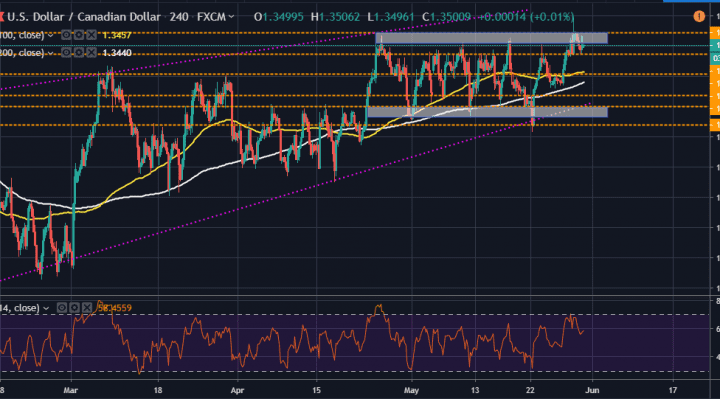
Technically, the USD/CAD currency pair appears to be trading within a horizontal channel, which suggests short-term volatility that is limited to about 200 pips on the full swing. This gives traders some interesting opportunities to target.
The bulls will be targeting profits at around 1.3521 while the bears will be hoping for a pullback towards the 1.3486 level.
USD/CAD Technical Analysis (the Daily Chart)
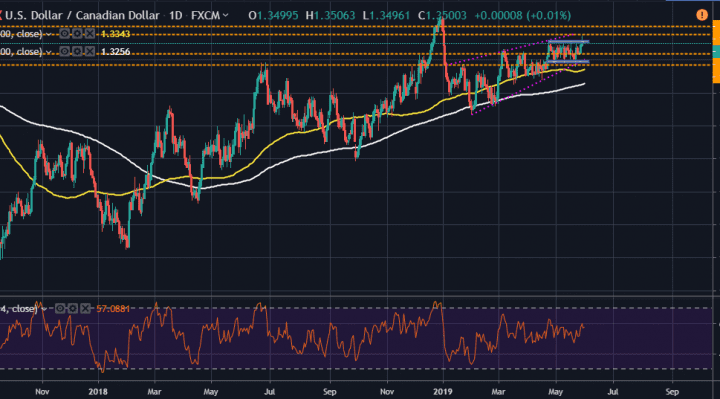
In the daily chart, the USD/CAD currency pair appears to be trading within an ascending channel, which is forming a consolidative pattern near the end. This suggests that the greenback might be suffering exhaustion after an extended period of gains against the loonie.
Nonetheless, there are still some interesting opportunities that both the bulls and the bears can target as demonstrated in the chart.
And with both the 100-day and the 200-day moving average lines well below, a short-term bearish breakout could be on the cards. The RSI shows that the pair is yet to reach overbought levels so the bulls still maintain long-term control.
In summary, the bears will look to pounce on an inevitable pullback in the coming days but the bulls will remain in control in the long-term.