
The USD/CAD currency pair on Wednesday pulled back off weekly highs of about 1.3620 to trade at around 1.3510 after finding strong support. The pair continues to trade within a relatively sideways channel. This indicates a lack of clear directional momentum in the market sentiment.
Today’s pullback pushed the currency pair inside oversold levels of the 14-hour RSI in the 60-min chart. The pair has also slipped below the 100-hour and the 200-hour SMA lines.
USD/CAD Fundamentals Overview

From a fundamental perspective, the USD/CAD currency pair is trading at the back of a relatively busy period in both markets. On Wednesday, the Bank of Canada chose to keep the base interest rate unchanged at 0.25%. This came shortly after manufacturing sales for May beat the (MoM) expectation of 9.5% with a change of 10.7%. Traders will be looking forward to Thursday’s ADP employment data going into the tail-end of the week.
In the US, the CPI fr June beat the (MoM) expectation of 0.5% with a change of 0.6%. The (YoY) equivalent was in line at 0.6%. The CPI ex-food and energy also outperformed the (MoM) and (YoY) expectations of 0.1% and 1.1% with 0.2% and 1.2%, respectively. On Wednesday, industrial production for June outshone the (MoM) expectation of 4.3% with a change of 5.4%. Traders will be looking forward to Thursday’s retails sales adat and jobless claims.
USD/CAD Technical Analysis (the 60-min Chart)
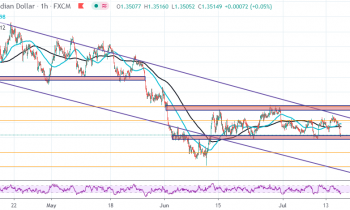
Technically, the USD/CAD currency pair appears to be trading within a sideways channel in the 60-min chart. This indicates a lack of directional momentum in the market sentiment. The recent pullback has pushed the pair to oversold levels of the 14-hour RSI, but this could be temporary.
The bulls will be targeting short-term rebound profits at around 1.3610 or higher at 1.3700. On the other hand, the bears will look to pounce at around 1.3400 or lower at 1.3310.
USD/CAD Technical Analysis (the Daily Chart)
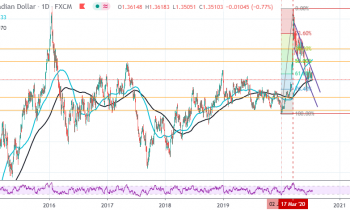
In the daily chart, the USD/CAD currency pair appears to be trading within a sharply descending channel. This indicates a strong long-term bearish bias in the market sentiment. The pair is now trading just off the 200-day SMA while the 100-day SMA is a few pips higher.
The bulls will be targeting long-term profits at around 50% and 38.20% Fib levels at 1.3810 and 1.4008, respectively. On the other hand, the bears will look to pounce for profits at around 1.3225 or lower at 1.3015.