
On Thursday, the USD/CAD currency pair bounced off the trendline support at 1.2885 to trade at about 1.2967 before pulling back. The currency pair appears to have found strong trendline resistance in an ascending channel formation.
The pair continues to trade several levels above the 100-hour moving average line in the 60-min chart. However, the late pullback prevented the currency pair from advancing into the overbought conditions of the 14-hour RSI.
USD/CAD Fundamentals Overview

From a fundamental perspective, the USD/CAD currency pair is trading at the back of a relatively busy period in the US market. On Thursday, the initial jobless claims for last week came in slightly lower at 250k compared to a forecast of 265k claims. On the other hand, the continuing claims for the preceding week also beat the expected claim count of 1.438 million with a slightly lower tally of 1.437 million. Earlier in the week, the retail sales control group for July beat the expectation of 0.6% with 0.8%, while general retail sales missed the forecast of 0.1% with 0% (MoM).
In Canada, the raw material price index for July missed the expectation of 0% with a change of -7.4%. On the other hand, the industrial product price missed 1% with a change of -2.1%, while the employment insurance beneficiaries’ change for June was -1.4% compared to a change of 0.3% in the previous reading. Earlier in the week, the BoC’s consumer price index for July missed the forecast of 6.7% with a change of 6.1% (YoY).
USD/CAD Technical Analysis (the 60-min Chart)
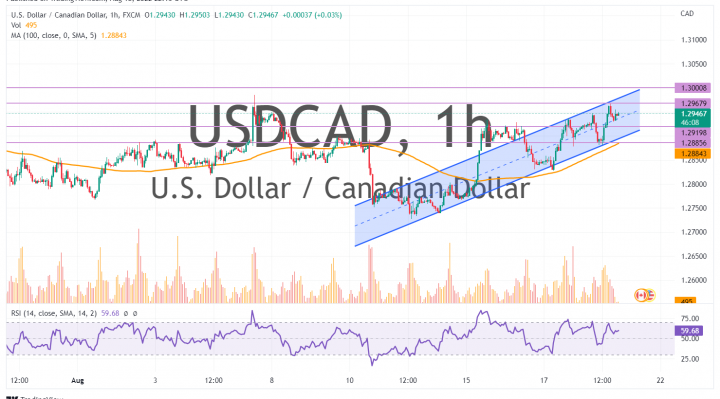
Technically, the USD/CAD currency pair seems to be trading within an ascending channel formation in the 60-min chart. This indicates a significant short-term bullish bias in the market sentiment.
Therefore, the bears will be targeting potential pullback profits at about 1.2919, or lower at 1.2885. On the other hand, the bulls will look to pounce on profits at about 1.2967, or higher at 1.3000.
USD/CAD Technical Analysis (the Daily Chart)
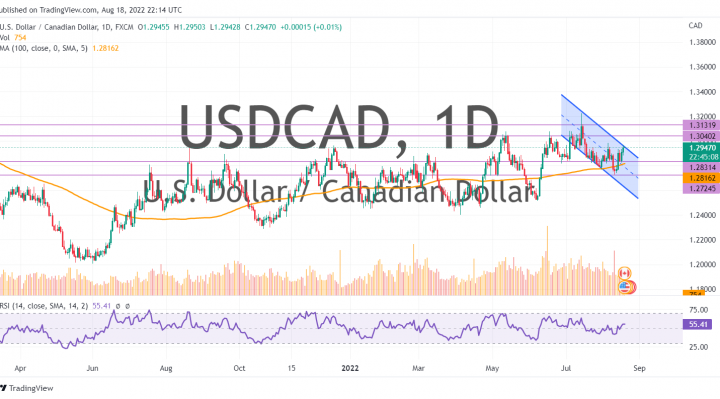
In the daily chart, the USD/CAd currency pair seems to be trading within a descending channel formation. This indicates a significant long-term bearish bias in the market sentiment.
Therefore, the bears will be looking to extend the current declines toward 1.2831 or lower to 1.2724. On the other hand, the bulls will be targeting long-term profits at about 1.3040, or higher at 1.3131.