
The USD/CAD currency pair on Wednesday bounced off the 100-hour MA at about 1.3590 to trade at about 1.3626 before pulling back to 1.3603. The currency pair appears to be trading within a sideways channel formation in the 60-min chart.
The pair continues to trade slightly above the 100-hour moving average line despite the late pullback. As a result, the currency pair seems to be pinned centrally in the 14-hour RSI.
USD/CAD Fundamentals Overview

From a fundamental perspective, the USD/CAD currency pair is trading at the back of a relatively busy period in the US market. On Wednesday, the US ADP Employment Change for April outshone the expected tally of 148k with a higher figure of 296k. The ISM Services PMI for the period also beat the estimated reading of 51.8 with a reading of 51.9.
However, the ISM Services Prices Paid missed the forecast of 59.9 with a reading of 59.6, while the Employment Index and New Orders Index also fell short of 52.6 and 57, with a reading of 50.8 and 56.1, respectively. Elsewhere, the S&P Global Services PMI and the PMI composite missed the estimates of 53.7 and 53.5 with a reading of 53.6 and 53.4, respectively.
Earlier in the week, the US ISM Manufacturing PMI for April beat the expected reading of 46.6 with a reading of 47.1. The ISM Manufacturing Prices Paid also outshone 50.4 with a reading of 53.2, while the Manufacturing Employment Index and New Orders Index beat 47.9 and 45.5 with a reading of 50.2 and 45.7, respectively.
USD/CAD Technical Analysis (the 60-min Chart)
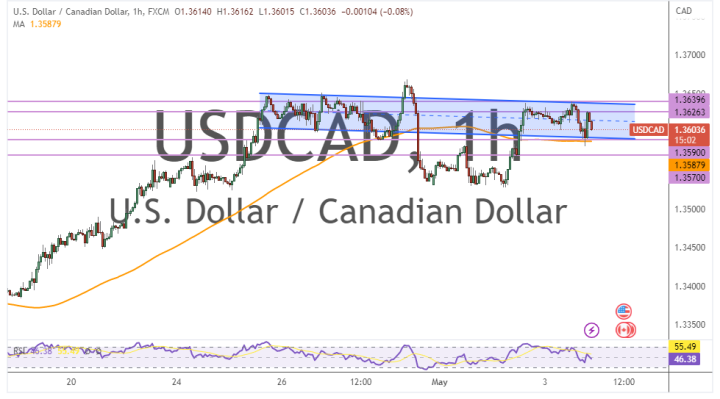
Technically, the USD/CAD currency pair appears to be trading within a sideways channel formation in the 60-min chart. This indicates a lack of clear directional bias in the market sentiment.
Therefore, the bulls will be targeting potential profits at about 1.3626 or higher at 1.3639. On the other hand, the bears will look to pounce on pullback profits at about 1.3590 or lower at 1.3570.
USD/CAD Technical Analysis (the Daily Chart)
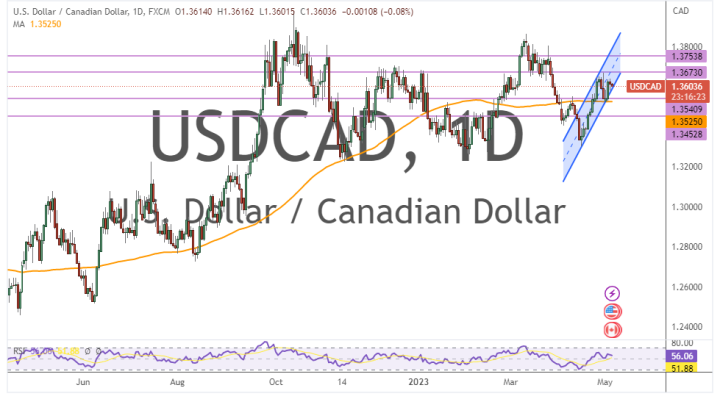
In the daily chart, the USD/CAD currency pair appears to be trading within an ascending channel formation. This indicates a significant long-term bullish bias in the market sentiment.
Therefore, the bulls will be looking to ride the current rally towards 1.3673 or higher to 1.3753. On the other hand, the bears will be targeting long-term profits at about 1.3540 or lower at 1.3452.