
On Monday, the USD/CAD currency pair pulled back off the session highs of about 1.4429 to trade at about 1.4374. The currency pair trades within a sideways channel formation in the 60-minute chart.
The pair has now fallen to trade at the 100-hour moving average line. However, the currency pair still seems to have a lot of room left to run before reaching the oversold levels of the 14-hour RSI.
USD/CAD Fundamentals Overview

From a fundamental perspective, the USD/CAD trades during a relatively busy period in both markets. On Monday, Canada’s gross domestic product for October beat the expected (MoM) change of 0.1% with a change of 0.3%, up from 0.2% in September. The (YoY) equivalent also outshone the estimate of 0.3% with a change of 0.6%, down from the preceding month’s equivalent of 1.2%, while the raw materials price index for November missed the forecast of 0.6% with -0.5%, down of 4%.
In the U.S., the durable goods for November missed the expectation of -0.4% with a change of -1.1%, down from 0.8% in October, while the durable goods orders ex-transportation fell short of 0.3% with a change of -0.1%, down from 0.2%.
On the other hand, the nondefense capital goods orders for the month delivered a change of 0.7%, up from the preceding month’s equivalent of -0.1%. Elsewhere, new home sales for November beat the expectation of 0.65 million with a tally of 0.664 million, up from 0.627 million. The new home sales change also improved to 5.9%, up from -14.8% (MoM).
USD/CAD Technical Analysis (the 60-min Chart)
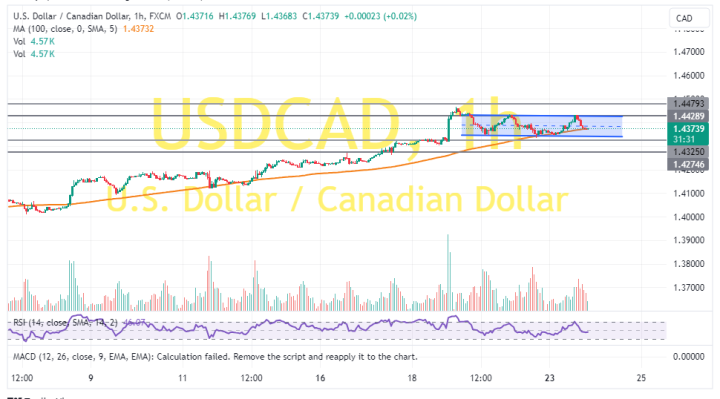
Technically, the USD/CAD currency pair trades within a sideways channel formation in the 60-minute chart. The 14-hour RSI has recently pulled back to avoid rallying into the overbought conditions.
Therefore, the bears will look to stretch the current pullback towards 1.4325 or lower to 1.4274. On the other hand, the bulls will look to pounce on profits at about 1.4429 or higher at 1.4479.
USD/CAD Technical Analysis (the Daily Chart)
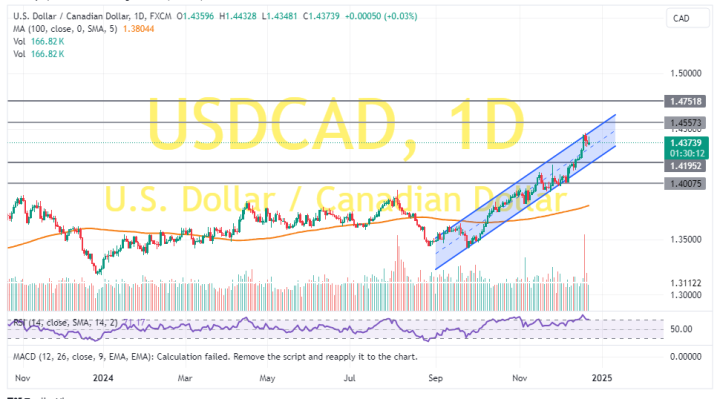
In the daily chart, the USD/CAD currency pair trades within an ascending channel formation. The 14-day RSI has also rallied to enter the overbought conditions of the indicator, supporting a bullish bias.
Therefore, the bulls will be looking to stretch the current rally towards 1.4557 or higher to 1.4751. On the other hand, the bears will look to pounce on profits at about 1.4195 or lower at 1.4007.