
On Thursday, the USD/CAD currency pair pulled back from the session highs of about 1.4436 to trade at about 1.4410. The currency pair trades within a consolidative triangle formation in the 60-minute chart.
The pair has now descended to trade closer to the 100-hour moving average line. However, the currency pair still has room left to run before reaching the oversold levels of the 14-hour RSI.
USD/CAD Fundamentals Overview

From a fundamental perspective, the USD/CAD currency pair trades during a relatively busy period in both the U.S. market. On Thursday, the preliminary annualised U.S. gross domestic product for Q4 missed the expected change of 2.6% with a change of 2.3%. The preliminary U.S. gross domestic product –price index for the quarter also fell short of 2.5% with a change of 2.2%.
On the other hand, the initial U.S. jobless claims for last week beat the forecasted claim count of 220k with a significantly lower tally of 207k, down from the preceding week’s equivalent of 223k. The US pending home sales for December fell short of the forecasted (MoM) change of 0% with a change of -5.5%. Earlier in the week, the Federal Reserve chose to keep the base interest rate unchanged at 4.5%, in line with expectations.
In Canada, the Bank of Canada lowered the base interest rate by 25 basis points to 3%, down from 3.25%, in line with expectations. Traders will be looking forward to the Canadian gross domestic data for November on Friday, ahead of the U.S. spending data.
USD/CAD Technical Analysis (the 60-min Chart)
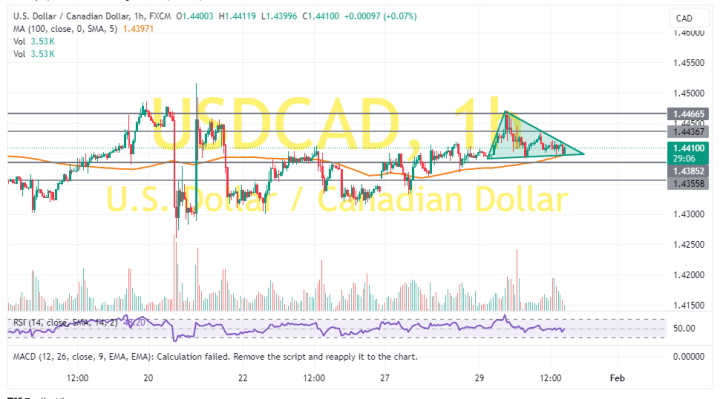
Technically, the USD/CAD currency pair trades within a consolidative triangle formation in the 60-minute chart. The 14-hour RSI seems to have room for both the bulls and the bears to strike.
Therefore, the bulls will be targeting potential upward profits at about 1.4436 or higher at 1.4466. On the other hand, the bears will look to pounce on downward movements at about 1.4385 or lower at 1.4355.
USD/CAD Technical Analysis (the Daily Chart)
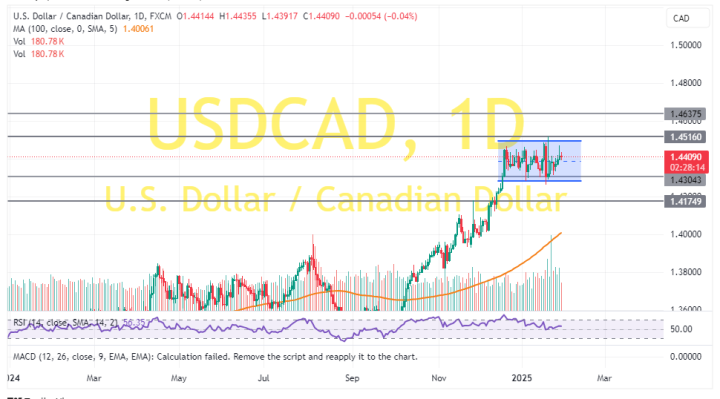
In the daily chart, the USD/CAD currency pair trades within a highly volatile sideways channel formation. The 14-day RSI has recently pulled back to recover from overbought conditions.
Therefore, the bears will look to stretch the current pullbacks toward 1.4304 or lower to 1.4175. On the other hand, the bulls will look to pounce on profits at about 1.4516 or higher at 1.4637.