
The USD/CAD currency pair on Thursday plunged to trade around 1.2656 following the latest round of the US data. The currency pair appears to have completed a downward channel breakout following the pullback.
The pair also fell to trade below the 100-hour moving average in the 60-min Chart. It has since moved closer to the oversold conditions of the 14-hour RSI. Therefore, a rebound could be on the horizon.
USD/CAD Fundamentals Overview

From a fundamental perspective, the USD/CAD currency pair is trading at the back of a very busy period in the US market. On Thursday, the annualized US Gross Domestic Product for Q2 beat the expectation of 6.6% with a change of 6.7%. On the other hand, the Gross Domestic Product Index for the quarter outperformed 6.1% with 6.2%, while the core personal consumption expenditures were in line with expectations.
However, the Chicago Purchasing Manager’s Index for September missed the expectation of 65 with 64.7, while the initial and continuing jobless claims also disappointed. Traders will be looking forward to Friday’s core personal consumption expenditures price index, the ISM Manufacturing PMIs, and personal income data.
In Canada, the raw materials price index and industrial production price index for August fell by 2.4% and 0.3%, respectively compared to the previous period’s increase of 2.2% and decline of 0.2%. Traders will be looking forward to Friday’s GDP and Markit manufacturing data.
USD/CAD Technical Analysis (the 60-min Chart)
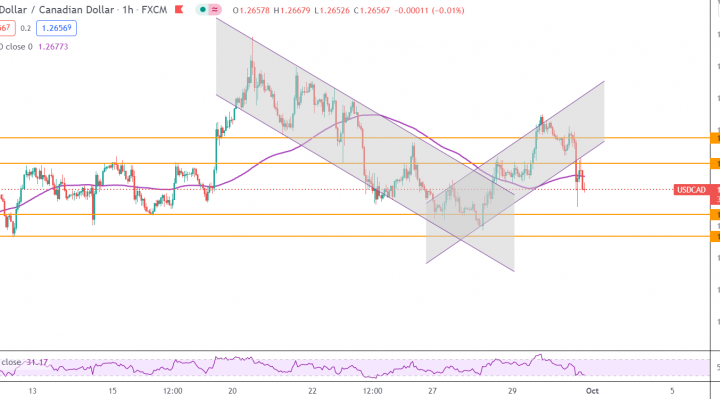
Technically, the USD/CAD currency pair seems to have recently pulled back to complete a bearish breakout from an ascending channel formation. The currency pair has since moved closer to the oversold conditions of the 14-hour RSI.
Therefore, the bulls will be targeting potential rebound profits at around 1.2697 or higher at 1.2737. On the other hand, the bears will be looking to stretch the current declines towards 1.2617or lower to 1.2583.
USD/CAD Technical Analysis (the Daily Chart)
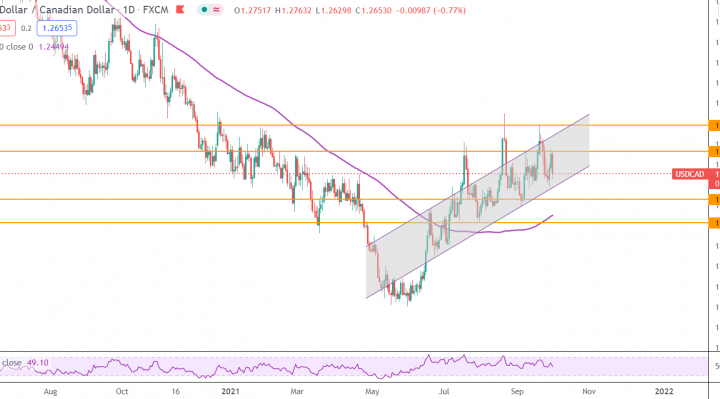
In the daily chart, the USD/CAD currency pair appears to be trading within an ascending channel formation. This indicates a significant long-term bullish bias in the market sentiment.
Therefore, the bulls will be looking to ride the current bull-run by targeting profits at around 1.2763 or higher at 1.2891. On the other hand, the bears will target long-term profits at 1.2528 or lower at 1.2414.