
The USD/CAd currency pair spiked on Wednesday to trade at about 1.3329, a new 4-week high in the process recouping all of yesterday’s losses. The currency pair is now on the positive side of the chart from the perspective of the greenback and this comes despite disappointing US data.
The rally comes at the back of a bearish curve that dates back to late last month, which followed a considerable period of weakening bullish run. The pair is now in the overbought levels of the RSI indicator and this could trigger the next pullback.
USD/CAD Fundamentals Overview

From a fundamental perspective, the USD/CAD currency pair is trading at the back of a definitive couple of days in the US market. Yesterday, the US ISM Manufacturing PMI (Sep) hit the lowest level in 10 years coming in at 47.8. Analysts were expecting a figure of 50.1.ISM Prices Paid for last month, however, outperformed with 49.7 versus an expectation of 48.5. The Markit Manufacturing PMI (Sep) also beat with 51.1 versus 51.0.
On the other hand, Canadian GDP missed expectations of 0.1% with 0.0% (MoM) for July while the Markit Manufacturing PMI for September beat expectations of 50.4 with 51.0.
And on Wednesday, the US ADP Employment Change missed expectations of 140k with 135k jobs while the ISM-NY Business Conditions Index (Sep) also underperformed with 42.8 versus an expectation of 47.5 and down from 50.3 in the previous month.
USD/CAD Technical Analysis (the 60-min Chart)
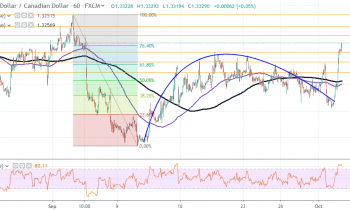
Technically, the USD/CAd currency pair appears to have already hit overbought levels of the RSI indicator in the 60-min chart. This indicates a short-term bullish bias following today’s sharp rise. However, after hitting the overbought levels, it looks like a pullback could be next in the cards with buyers rushing to take some profits.
Therefore, the bears will be targeting short-term profits at around 1.3311, 1.3292 or lower at 1.3273. On the other hand, the bulls will hope that the upward momentum remains steady to carry the pair towards 1.3343, 1.3359 or higher at 1.3382.
USD/CAD Technical Analysis (the Daily Chart)
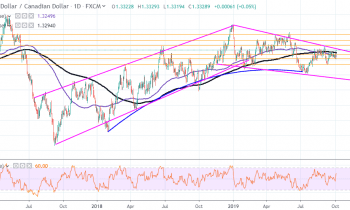
In the daily chart, the USD/CAD currency pair appears to be trading under modest bearish pressure in a slanting wedge after a recent reversal in the trendline. The wedge formation dates back to the start fo this year coming off an extended period of a bullish run that dates back to late 2017.
The pair also appears to be forming a consolidative pattern over the last two months and this could trigger the next breakout. The bulls will target long-term profits at around 1.3458 or higher at 1.3534 while the bears will look to pounce at around 1.3219 or lower at 1.3142.
In summary, the USD/CAd currency pair appears to be experiencing a short-term bullish pressure but in the long-term, the bears are still clinging on.