
The USD/JPY currency pair n Friday bounced off the current 4-month low of about 105.680 to surge above 106.076 after plunging during the week. The currency pair appears to have dropped off a sideways channel in the 60-min chart, which indicates an abrupt shift in the market sentiment towards the bears.
The currency pair’s late rebound on Friday pulled it off oversold levels of the 14-hour RSI after finding temporary trendline support on the way down.
USD/JPY Fundamentals Overview

From a fundamental perspective, the USD/JPY currency pair is trading at the back of a relatively busy period in the US market. Activity in Japan was limited to the first few days of the week. In the late hours of Sunday evening, Japan’s adjusted merchandise trade balance for June missed the expectation of -302.3B Yen with Y-423.9B. The Total merchandise trade balance also came short of -35.8B Yen with Y-268.8B. The change in imports for June beat the (YoY) expectation of -16.8% with -14.4%. On the other hand, Exports missed -24.9% with -26.2%. Late on Monday evening, Japanese CPI outperformed on all fronts, ex-food and energy, and National CPI.
In the US, the housing price index for May missed the (MoM) expectation of 0.3% with -0.3%. Existing home sales for June narrowly missed 4.78M (MoM) with 4.72M while existing home sales change was way off the mark with 20.7% (MoM) versus 24.5% expected. On Thursday, the initial jobless claims came short of 1.3M with 1.416M while continuing claims impressed with 16.197M versus 17.067M. On Friday the preliminary Markit Manufacturing and Services PMIs for July were short of expectations while new home sales and home sales change for June impressed.
USD/JPY Technical Analysis (the 60-min Chart)
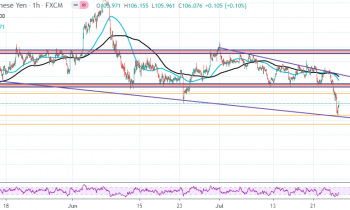
Technically, the USD/JPY currency pair appears to be experiencing a short-term bearish pressure in the market sentiment. The pair has recently bounced off oversold levels of the 14-hour RSI in the 60-min chart.
The bulls will be targeting short-term rebound profits at around 106.417 or higher at 106.724. On the other hand, the bears will look to extend declines towards 105.680 or lower at 105.367.
USD/JPY Technical Analysis (the Daily Chart)
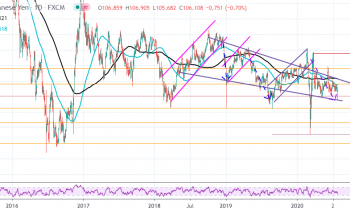
In the daily chart, the USD/JPY currency pair appears to be trading within a slightly descending consolidative wedge. This indicates a slight long-term bearish bias in the market sentiment.
The bears will look to retain long-term control by targeting profits at around 104.553 or lower at 102.642. On the other hand, the bulls will target profits at around 107.615 or higher at 109.643.