
On Friday, the USD/JPY currency pair bounced off the key support at about 146.00 to trade at the current 2-month high of 148.93. The currency pair trades within an ascending channel formation in the 60-minute chart.
The pair has now advanced to trade a few levels above the 100-hour moving average line. As a result, the currency pair is now trading deep into the overbought levels of the 14-hour RSI.
USD/JPY Fundamentals Overview

From a fundamental perspective, the USD/JPY currency pair trades during a relatively busy period in both markets. On Friday, the US unemployment rate for September edged slightly lower to 4.1% down from 4.2% in August, beating the forecasted rate of 4.2%.
The average hourly wage for the month also impressed with a (MoM) change of 0.4% versus a forecast of 0.3%, while the (YoY) equivalent beat the estimate of 3.8% with a change of 4%. On the other hand, the nonfarm payrolls for the period exceeded expectations of 140k with a tally of 254k, up from the preceding month’s equivalent of 159k.
In Japan, the unemployment rate fell lower than expected to 2.5% down from 2.7%. Analysts had forecasted a rate of 2.6%. On the other hand, the Tankan Large All Industry CapEx for Q3 missed the forecast of 11.3% with a rate of 10.6%, while the Tankan Large Manufacturing Index was in line with the forecast of 13.
Elsewhere, the Japanese retail trade for August outshone the forecasted (YoY) change of 2.3% with a change of 2.8%, while large retail sales grew by 5%.
USD/JPY Technical Analysis (the 60-min Chart)
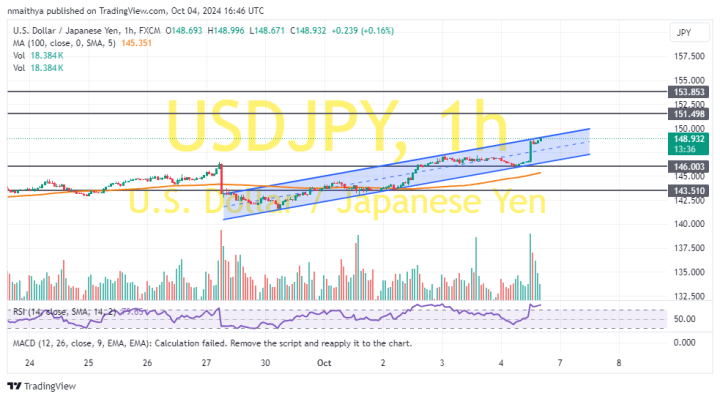
Technically, the USD/JPY currency pair trades within an ascending channel formation in the 60-minute chart. The 14-hour RSI also supports a bullish bias after rallying deep into overbought conditions.
Therefore, the bulls will look to stretch the current gains toward 151.49 or higher to 153.85. On the other hand, the bears will look to pounce on pullbacks at about 146.00 or lower at 143.51.
USD/JPY Technical Analysis (the Daily Chart)
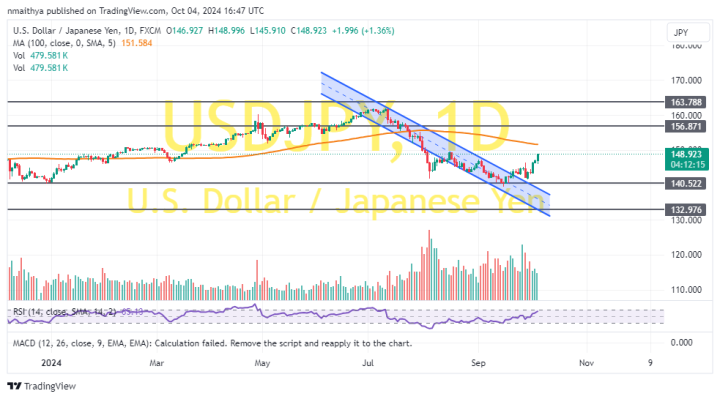
In the daily chart, the USD/JPY currency pair has completed an upward breakout from a descending channel formation. The 14-day RSI also supports a bullish bias as it moves towards overbought conditions.
Therefore, the bulls will be targeting long-term profits at about 156.87 or higher at 163.78. On the other hand, the bears will look to pounce on profits at about 140.52 or lower at 132.97.