
The USD/JPY currency pair on Friday plunged to trade at a new multi-month low of about 103.177 before bouncing back to settle at 103.342. The currency pair extended the mid-week losses despite positive data from the latest round of US non-farm payrolls.
The pair is now pinned several levels below the 100-hour and the 200-hour SMA lines in the 60-min chart. The latest plunge also pushed it to oversold levels of the 14-hour RSI. However, the late rebound pushed it back to the normal trading zone.
USD/JPY Fundamentals Overview

From a fundamental perspective, the USD/JPY currency pair is trading at the back of a very busy period in the US market. The presidential election appears to be determining the current market movement amid an impasse in final results. Former VP Joe Biden continues to lead incumbent Trump who has threatened to go to court citing irregularities and fraud. This has put the markets on caution, which has affected the performance of the US dollar.
In the latest round of economic data, the US non-farm payrolls beat the expected jobs tally of 600k with 638k jobs. The unemployment rate also edged lower than expected to 6.9% versus 7.7% while the average hourly wage for October missed the expected (YoY) growth of 4.6% with 4.5%. The (MoM) equivalent also disappointed with 0.1% versus an expectation of 0.2%.
In Japan, overall household spending for September beat the expected (YoY) change of -10.7% with -10.2%. Labor cash earnings for the period also outperformed the estimated change of -2.2% (YOY) with -0.9%.
USD/JPY Technical Analysis (the 60-min Chart)
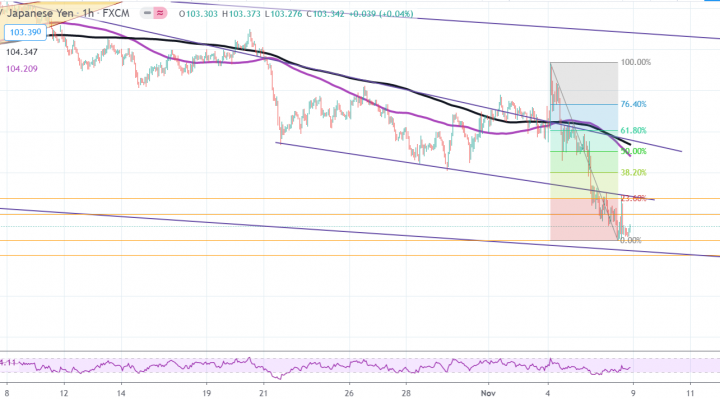
Technically, the USD/JPY currency pair appears to have recently bounced off multi-month lows after a huge plunge during the week. The pair is now trading a few levels above the 0.00% fib level on the way up. It has also recovered from oversold levels of the 14-hour RSI.
The bulls will be looking to ride this recovery by targeting profits at around 103.498 or higher at the 23.60% fib level at 103.684. On the other hand, the bears will look to pounce for profits at around the 0.00% fib level at 103.177 or lower at 103.000.
USD/JPY Technical Analysis (the Daily Chart)
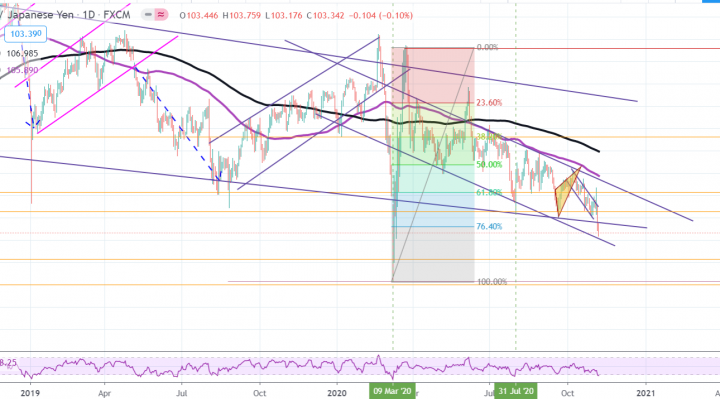
In the daily chart, the USD/JPY currency pair appears to be trading within a gently descending channel. This indicates a long-term bearish bias in the market sentiment. The pair is close to crossing to oversold levels of the 14-day RSI.
The bulls will be targeting long-term rebound profits at around 104.286 or higher at 61.80% fib level at 106.169. On the other hand, the bears will look to pounce for profits at around 102.171 or lower at the 100.00% fib level at 101.000.