
On Thursday, the USD/JPY currency pair bounced back from the session lows of about 158.55 to trade at about 159.42. The currency pair trades within an ascending channel formation in the 60-minute chart.
The pair continues to trade a few levels above the 100-hour moving average line after the latest rebound. As a result, the currency pair is on the verge of entering the overbought levels of the 14-hour RSI.
USD/JPY Fundamentals Overview

From a fundamental perspective, the USD/JPY currency pair trades during a relatively busy period in both markets. In Japan, the gross domestic product for Q4 matched the (QoQ) forecast of 0.3%. The annualized gross domestic product for the quarter came in better than expected, with 1.3% versus a forecast of 1.2%, while the gross domestic product deflator for the period matched the (YoY) expectation of 3.4%.
Earlier in the week, Japanese labor cash earnings for January grew by 3%, compared to a change of 2.4% in the previous update.
In the US, the initial jobless claims for last week edged slightly lower to 213k, down from 214k in the previous week, beating the forecasted claim count of 215k. Housing starts for January also came in better than expected, with 1.487 million versus a forecast of 1.35 million, up from the previous month’s equivalent of 1.387 million.
On the other hand, the building permits for the month fell short of the forecasted tally of 1.41 million, with 1.376 million, down from 1.455 million in the previous update. Looking forward, traders will be waiting for the personal consumption data for January on Friday.
USD/JPY Technical Analysis (the 60-min Chart)
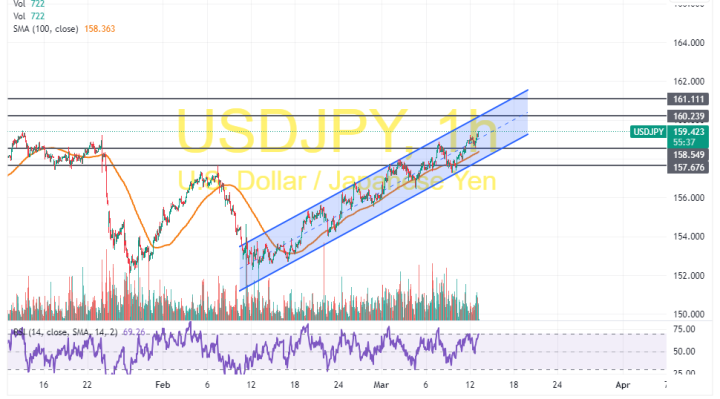
Technically, the USD/JPY currency pair trades within an ascending channel formation in the 60-minute chart. The 14-hour RSI also supports a bullish bias as it edges closer to overbought conditions.
Therefore, the bulls will look to stretch the latest rebound towards 160.24 or higher to 161.11. On the other hand, the bears will look to pounce on pullbacks at about 158.55 or lower at 157.67.
USD/JPY Technical Analysis (the Daily Chart)
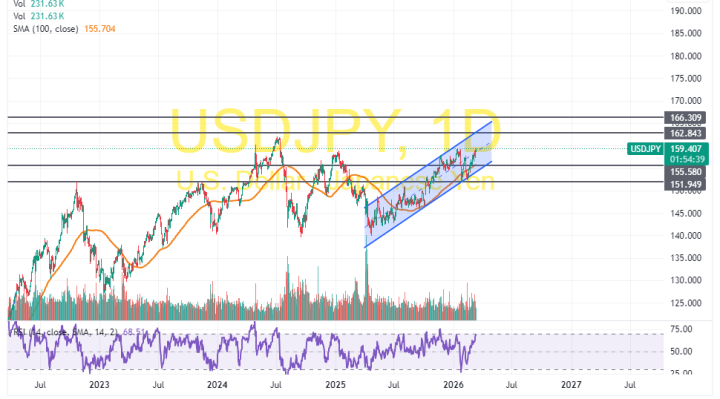
In the daily chart, the USD/JPY currency pair also trades within an ascending channel formation. The 14-day RSI also supports a long-term, bullish bias as it edges closer to overbought conditions.
Therefore, the bulls will look to ride the current run of gains toward 162.84 or higher to 166.31. On the other hand, the bears will look to pounce on profits at about 155.58 or lower at 151.95.