
The USD/JPY currency pair on Friday bounced off a new weekly low of about 103.841 to trade at around 104.035 on upbeat Michigan Consumer Sentiment Index data. The currency pair continues to trade in a descending channel in the 60-min chart.
The pair is now pinned just below the 100-hour and the 200-hour SMA lines. Friday’s late rebound prevented the currency pair from crossing to oversold levels of the 14-hour RSI.
USD/JPY Fundamentals Overview

From a fundamental perspective, the USD/JPY currency pair is trading at the back of a relatively busy period in both markets. On Friday, the preliminary Michigan Consumer Sentiment Index for December beat the expectation of 76.5 with 81.4. The US PPI ex-food and energy for November missed the (YoY) expectation of 1.55 with a change of 1.4%.
The (MoM) equivalent also came short of 0.2% with 0.1%. On Thursday, the US CPI ex-food and energy for November beat the (MoM) expectation of 0.1% with a change of 0.2%. The (YoY) equivalent matched 1.6%. General CPI beat the (YoY) expectation of 1.1% with 1.2% while the (MoM) equivalent was in line with 0.2%.
Earlier in the week, the Japanese gross domestic product for Q3 beat the (QoQ) expectation of 5% with a change of 5.3%. Annualized GDP beat 21.5% with 22.9%. On the other hand, overall household spending for October missed the expected change of 2.5% with a change of 1.9% (YoY).
USD/JPY Technical Analysis (the 60-min Chart)
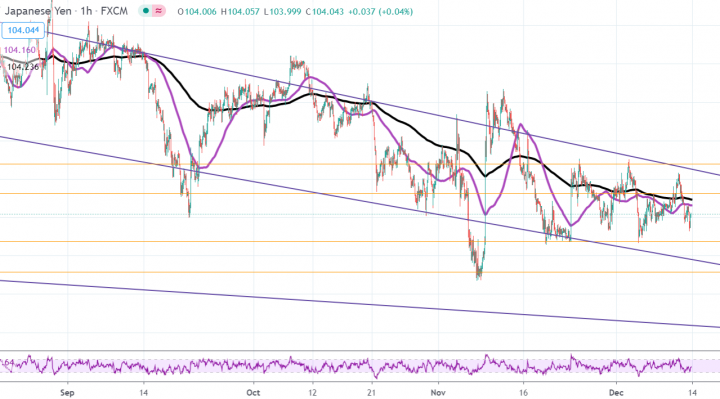
Technically, the USD/JPY currency pair appears to be trading within a gently descending channel in the 60-min chart. This indicates a slight short-term bearish bias in the market sentiment. It is also closer to oversold levels of the 14-hour RSI.
The bulls will be targeting short-term rebound profits at around 104.314 or higher at 104.699. On the other hand, the bears will look to pounce for short-term profits at around 103.682 or lower at 103.290.
USD/JPY Technical Analysis (the Daily Chart)
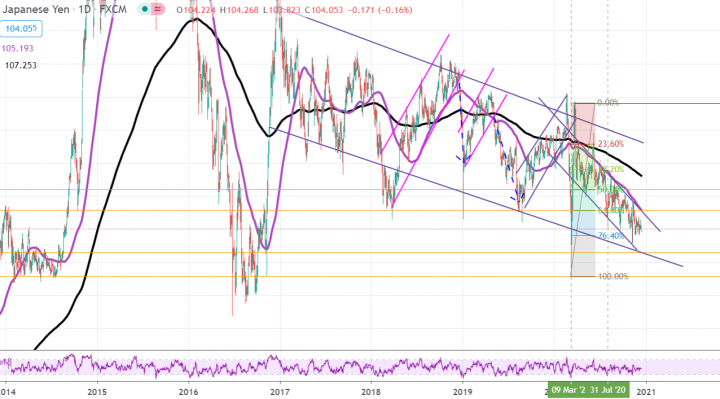
In the daily chart, the USD/JPY currency pair appears to be trading within a sharply descending channel. This indicates a strong long-term bearish bias in the market sentiment. The pair has now pulled back closer to the 76.40% fib level.
The bears will be looking to extend the current downward movement towards 102.613 or lower to 100% fib level at 101.173. On the other hand, the bulls will target profits at around 61.80% and 50% fib levels at 105.178 and 106.410, respectively.