
The USD/JPY currency pair on Friday spiked to trade at a new session high of about 139.875 following the latest round of US data. The currency pair appears to have completed an upward breakout from a descending channel formation.
The pair also advanced to trade above the 100-hour moving average line in the 60-min chart. As a result, the currency pair appears to be on the verge of breaking into the overbought levels of the 14-hour RSI.
USD/JPY Fundamentals Overview

From a fundamental perspective, the USD/JPY currency pair is trading at the back of a relatively busy period in the US market. On Friday, the non-farm payroll data for May outperformed the expected job count of 190k with a tally of 339k. The labour force participation rate for the period also outshone the forecast of 62.5% with a rate of 62.6%, up from the previous month’s equivalent of 62.5%. Elsewhere, the unemployment rate for May missed the expectation of 3.5% with a rate of 3.7%, up from 3.5% in April, while the average hourly wage growth for the period also came short of the forecasted growth rate of 4.4% with a rate of 4.3%.
In Japan, the monetary base for May beat the expected (YoY) change of -2.3% with a change of -1.1%. On the other hand, capital spending for Q1 outshone the expected change of 5.5% with a change of 11%, while retail trade for April missed both the (MoM) and (YoY) expectations of 0% and 7%, respectively with a change of -1.2% and 5%. Large retailer sales beat the estimate of 3.8% with a change of 4.8%.
USD/JPY Technical Analysis (the 60-min Chart)
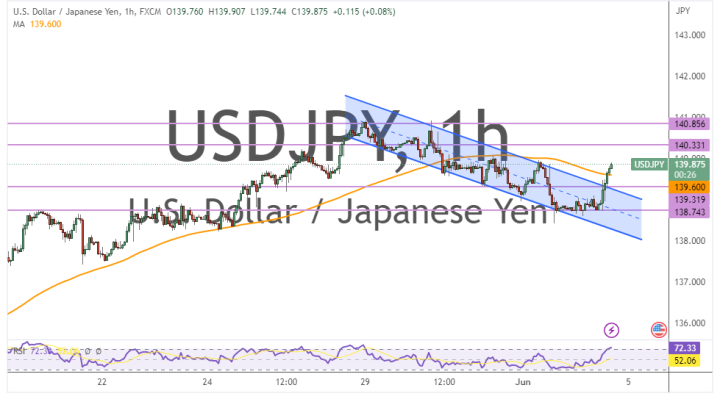
Technically, the USD/JPY currency pair appears to have completed an upward breakout from a descending channel formation. This indicates a significant change in the short-term market sentiment from bearish to bullish.
Therefore, the bulls will be looking to extend the current rebound towards 140.331 or higher to 140.836. On the other hand, the bears will be targeting potential pullbacks at about 139.319 or lower at 138.743.
USD/JPY Technical Analysis (the Daily Chart)

In the daily chart, the USD/JPY currency pair appears to be trading within an ascending channel formation. This indicates a significant long-term bullish bias in the market sentiment.
Therefore, the bulls will be looking to ride the current wave of gains toward 142.290 or higher to 145.078. On the other hand, the bears will look to pounce on long-term profits at about 137.545 or lower at 134.867.