
On Thursday, the USD/JPY currency pair pulled back from the session highs of about 156.06 to trade at about 155.17. The currency pair also completed a downward breakout from an ascending channel formation in the 60-minute chart.
The pair has now descended to trade a few levels below the 100-hour moving average line. As a result, the currency pair is on the verge of entering the oversold levels of the 14-hour RSI.
USD/JPY Fundamentals Overview

From a fundamental perspective, the USD/JPY currency pair trades during a relatively busy period in both markets. On Thursday, the U.S. initial jobless claims for last week came in worse than expected, with 236k versus a forecast of 220k, up from the preceding week’s equivalent of 192k. The continuing claims for the four weeks ended last week came in better than expected, with 1.838 million versus a forecast of 1.95 million, down from the preceding period’s equivalent of 1.937 million.
On Wednesday, the Federal Reserve lowered the base interest rate by 25 basis points to 3.75%, down from 4%, as expected. All other projections remained unchanged.
In Japan, labor cash earnings for October outperformed the (YoY) expectation of 2.2%, with a change of 2.6%. Bank lending for November also came in stronger than expected, with a change of 4.2% (YoY) versus a forecast of 4%.
On the other hand, the gross domestic product for Q3 missed the (QoQ) forecast of -0.5%, with a change of -0.6%, while the (YoY) equivalent fell short of -2%, with a change of -2.3%. The gross domestic product deflator for the quarter exceeded the expectation of 2.8%, with a change of 3.4% (YoY).
USD/JPY Technical Analysis (the 60-min Chart)
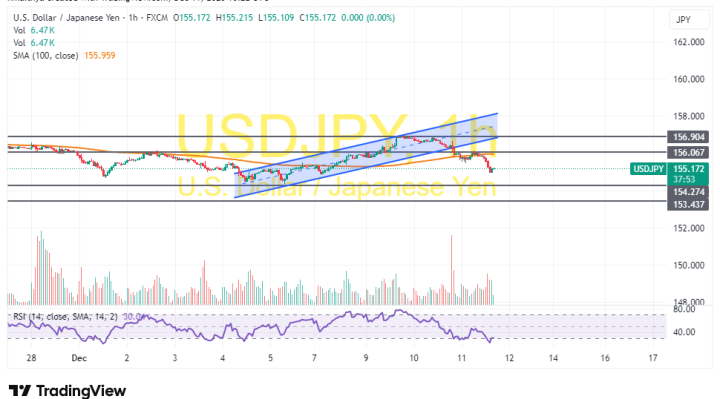
Technically, the USD/JPY currency pair has completed a downward breakout from an ascending channel formation in the 60-minute chart. The 14-hour RSI also supports a bearish bias as it edges closer to oversold conditions.
Therefore, the bears will look to stretch the current declines toward 154.27 or lower to 153.43. On the other hand, the bulls will look to pounce on rebounds at about 156.06 or higher at 156.90.
USD/JPY Technical Analysis (the Daily Chart)
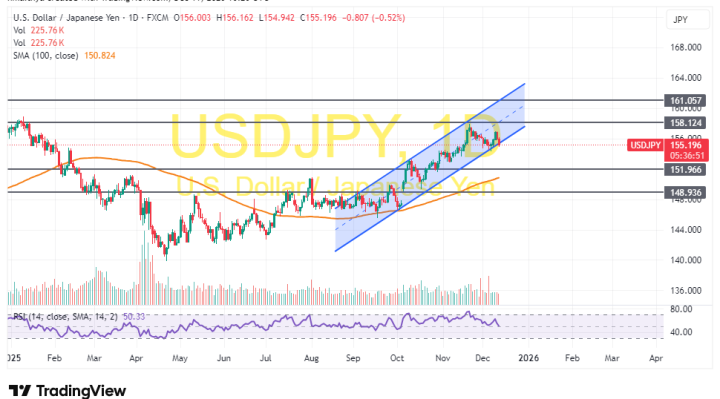
In the daily chart, the USD/JPY currency pair trades within an ascending channel formation. However, the 14-day RSI has recently pulled back to avoid rallying into overbought conditions.
Therefore, the bears will look to stretch the latest pullback towards 151.96 or lower to 148.93. On the other hand, the bulls will look to ride the current rally towards 158.12 or higher to 161.05.