
On Thursday, the USD/JPY currency pair extended Wednesday’s rebound from about 158.18 to trade at about 159.56. The currency pair trades within an ascending channel formation in the 60-minute chart.
The pair has now advanced to trade slightly above the 100-hour moving average line. However, the currency pair pulled back slightly to avoid entering the overbought levels of the 14-hour RSI.
USD/JPY Fundamentals Overview

From a fundamental perspective, the USD/JPY currency pair trades during a relatively busy period in both markets. In Japan, the unemployment rate for February came in better than expected, at 2.6% versus a forecast of 2.7%, down from 2.7% in January.
On the other hand, the Tokyo CPI ex-fresh food for March fell short of 1.8%, with a rate of 1.7% (YoY), while the retail sales for February missed the expected (YoY) change of 0.8%, with a change of -0.2%. Elsewhere, the Tankan Large Manufacturing Index for Q1 outperformed expectations, rising to 17 from 16. The Tankan Large Manufacturing Outlook also outshone the forecasted reading of 13, with a reading of 14, down from 15 in Q4.
In the US, the initial jobless claims for last week came in better than expected, with 202k versus a forecast of 212k, down from 211k. The ADP employment change also exceeded the forecasted change of 40k, with a change of 62, down from 66k. Elsewhere, the retail sales for February beat the expected (MoM) change of 0.5%, with a change of 0.6%, while the retail sales ex-autos outshone the estimate of 0.3%, with a change of 0.5%.
USD/JPY Technical Analysis (the 60-min Chart)
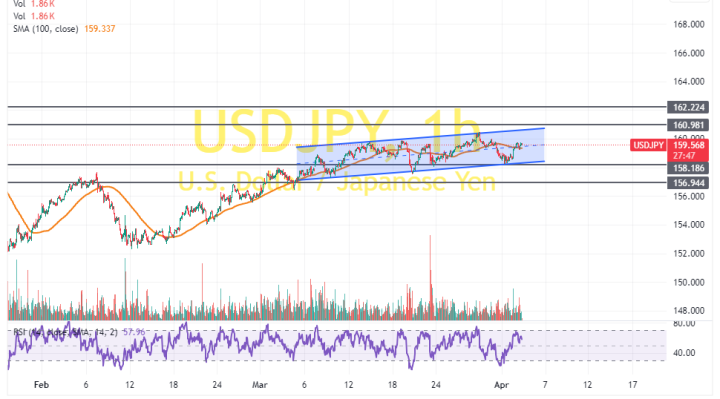
Technically, the USD/JPY currency pair trades within an ascending channel formation in the 60-minute chart. However, the 14-hour RSI has recently pulled back to avoid entering overbought conditions.
Therefore, the bears will look to extend the latest pullback towards 158.18 or lower to 156.94. On the other hand, the bulls will look to pounce on rebounds at about 160.98 or higher at 162.22.
USD/JPY Technical Analysis (the Daily Chart)
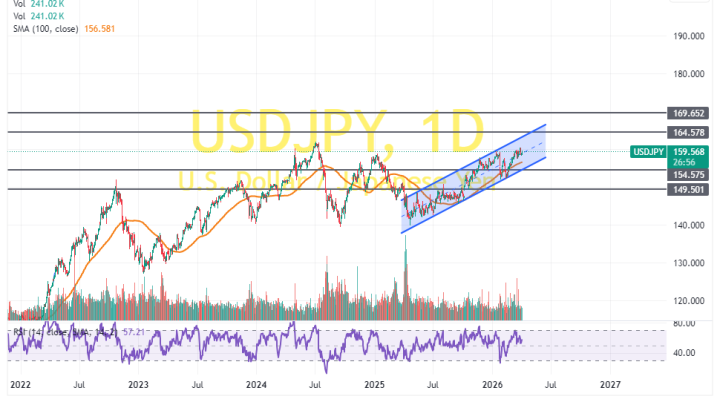
In the daily chart, the USD/JPY currency pair trades within an ascending channel formation. However, the 14-day RSI recently pulled back to avoid rallying into overbought conditions.
Therefore, the bears will be looking to stretch the current pullback towards 154.57 or lower to 149.50. On the other hand, the bulls will look to pounce on profits at about 164.57 or higher at 169.65.