
The USD/JPY currency pair on Friday failed to advance above the 100-hour moving average line after facing strong resistance. The currency pair continues to trade within an ascending channel formation in the 60-min chart.
The pair now remains pinned next to the 100-hour MA after pulling back later. As a result, the currency pair continues to trade within the normal zone of the 14-hour RSI.
USD/JPY Fundamentals Overview

From a fundamental perspective, the USD/JPY currency pair is trading at the back of a relatively busy period in both markets. On Friday, US personal income for November beat the expected (MoM) change of 0.2% with a change of 0.4%. On the other hand, personal spending missed the estimate of 0.2% with a change of 0.1%.
Elsewhere, the Michigan Consumer Sentiment Index for December outperformed the forecasted reading of 59.1 with a reading of 59.7, while new home sales outshone the expectation of 0.6 million with a tally of 0.64 million. Durable goods orders missed -0.6% with -2.1%, while nondefence capital goods orders beat 0% with a change of 0.2%.
In Japan, the National Consumer Price Index for November outperformed the (YoY) estimate of 3.7% with a change of 3.8%, while the National CPI ex-food and energy beat 2.7% with a change of 2.8% (YoY). Earlier in the week, the Bank of Japan decided to keep the base interest rate unchanged at -0.1%.
USD/JPY Technical Analysis (the 60-min Chart)
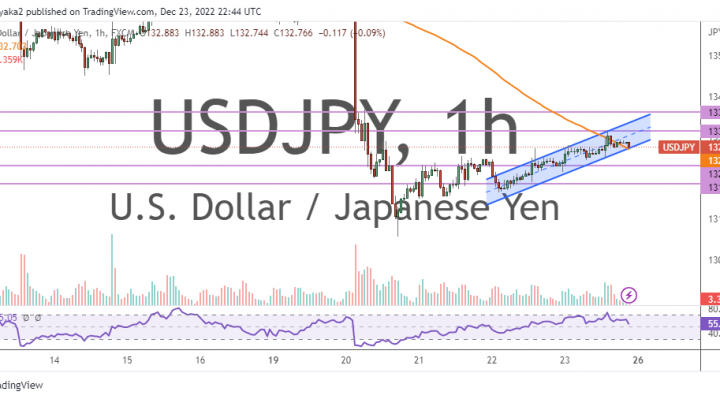
Technically, the USD/JPY currency pair appears to be trading within an ascending channel formation in the 60-min chart. This indicates a significant short-term bullish bias in the market sentiment.
Therefore, the bulls will be targeting short-term profits at about 133.145 or higher at 133.621. On the other hand, the bears will look to pounce on profits at about 132.308 or lower at 131.860.
USD/JPY Technical Analysis (the Daily Chart)
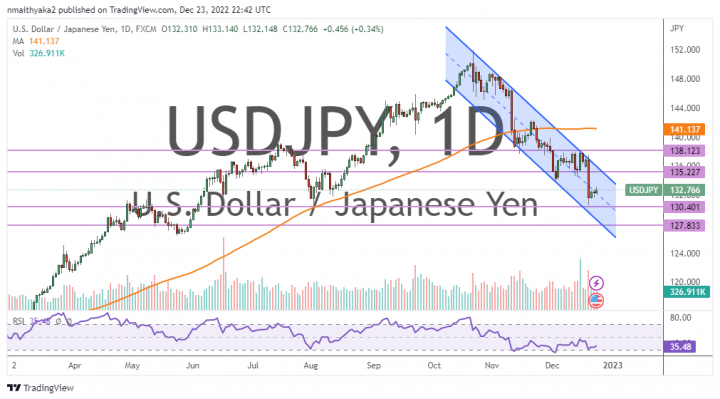
In the daily chart, the USD/JPY currency pair appears to be trading within a descending channel formation. This indicates a significant long-term bearish bias in the market sentiment.
Therefore, the bears will be looking to stretch the current declines toward 130.401 or lower to 127.833. On the other hand, the bulls will be targeting long-term profits at about 135.227 or higher at 138.123.