
The USD/JPY currency pair on Friday fell to a new 3-week low of 108.331 following the latest round of Japanese economic data. The currency pair is trading in a sharply descending channel, which indicates extreme short-term bearish bias in the market sentiment.
The pair crossed to the oversold levels of the RSI indicator amid increased selling pressure on Friday despite some strong US economic data.
USD/JPY Fundamentals Overview

From a fundamental perspective, Asian markets continue to struggle due to the outbreak of the coronavirus. This does not seem to be affecting the Japanese Yen, which continues to strengthen against the US dollar. The currency pair has been on a bearish run since the news of the coronavirus broke two weeks ago.
Besides the coronavirus outbreak, Japan released a series of economic figures during the week. On Wednesday, the Consumer Confidence Index for January missed the expectation of 40.8 with 39.1. And on Thursday’ Tokyo CPI ex-Fresh food for January came short of the (YoY) expectation of 0.8% with 0.7%. The general CPI missed 0.9% with 0.6% for the same period while CPI exp-food and energy was in line with expectation at 0.9%.
The Japanese unemployment rate for December remained unchanged at 2.2% beating the expectation of 2.3%. On the other hand, retail trade missed the (YoY) expectation of -1.8% with -2.6% while the (MoM) retail trade s.a. beat -4.5% with 0.2%.Industrial Production for December (YoY) and large retailer sales also came short of expectations.
In the US, the data released during the week was relatively a mixed basket.
USD/JPY Technical Analysis (the 60-min Chart)
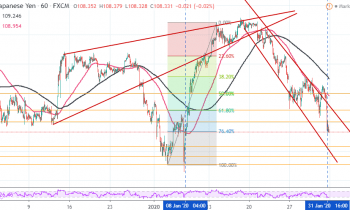
Technically, the USD/JPY currency pair appears to be trading under extreme short-term bearish pressure. The pair has been trading in a sharply diving channel since January 20. It continues to signal a huge bearish bias in the market sentiment.
Therefore, the bears will be targeting short-term profits at around 107.913 or lower at 107.775. On the other hand, the bulls will hope for a quick turnaround in market sentiment. They will target short-term profits at around 108.508 or higher at 108.706.
USD/JPY Technical Analysis (the Daily Chart)

In the daily chart, the USD/JPY continues to trade in an extended sideways channel. It appears to be highly volatile. The bulls appear to have taken intermediate control since August last year. The pair is now trading within an ascending chart off the main sideways wedge.
Therefore, the bulls will be targeting long-term profits at around 109.329 or higher at 110.164 going into next month. On the other hand, the bears will look to pounce for profits at around 107.022 or lower at 105.683.