
The USD/JPY currency pair on Friday failed to rally above the 145.000 level after finding strong resistance earlier in the week. The currency pair now appears to be trading within a consolidative sideways channel formation in the 60-min chart.
On the base, the 100-hour moving average line continues to provide strong support preventing more pullbacks, The currency pair seems to have room left to run before reaching the overbought conditions of the 14-hour RSI.
USD/JPY Fundamentals Overview

From a fundamental perspective, the USD/JPY currency pair is trading at the back of a relatively busy period in both markets. On Friday, the core personal consumption expenditures price index for Sep outshone the expected (MoM) change of 0.5% with a change of 0.6%. On The other hand, the (YoY) equivalent beat 4.7% with a change of 4.9%. Earlier in the week, the initial jobless claims for the week ending Sep 23 beat the expected claim count of 215k with a lower tally of 193k. Elsewhere, the US gross domestic product price index for Q2 outperformed the forecasted change of 8.9% with a change of 9.1%.
In Japan, the preliminary industrial production for August beat the expected (MoM) change of 0.2% with a change of 2.7%. On the other hand, the jobs-to-applicants ratio for the period outperformed the expectation of 1.3 with a higher ratio of 1.32, while the unemployment rate steadied at 2.5%, in line with estimates. On Friday, Japanese housing starts for August beat the expected (YoY) change of -4.1% with a change of 4.6%.
USD/JPY Technical Analysis (the 60-min Chart)
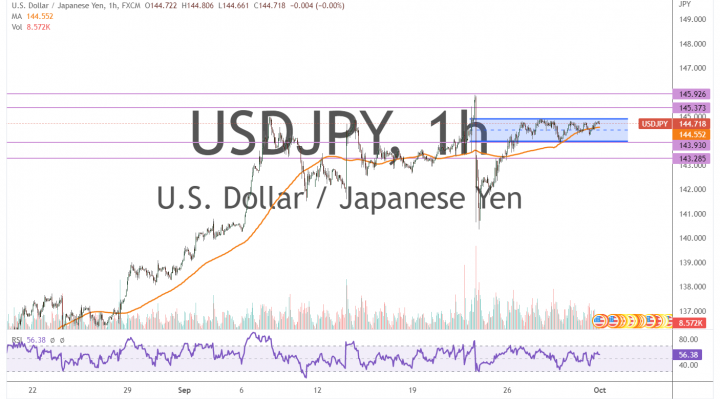
Technically, the USD/JPY currency pair seems to be trading within a sideways channel formation in the 60-min chart. This indicates a lack of a clear directional bias in the market sentiment.
Therefore, the bulls will be targeting short-term profits at about 145.373 or higher at 145.926. On the other hand, the bears will look to pounce on potential pullbacks at about 143.930 or lower at 143.282.
USD/JPY Technical Analysis (the Daily Chart)
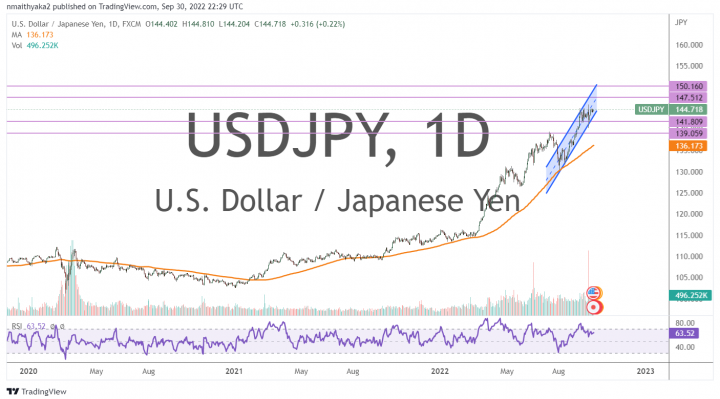
In the daily chart, the USD/JPY currency pair seems to be trading within a sharply ascending channel formation. This indicates a strong long-term bullish bias in the market sentiment.
Therefore, the bulls will be looking to ride the current rally towards 147.512 or higher to 150.160. On the other hand, the bears will be targeting long-term profits at about 141.809 or lower at 139.059.