
The USD/JPY currency pair on Friday plummeted to a new weekly low of about 113.470 after the latest manufacturing PMIs. The currency pair continues to trade within a descending channel formation in the 60-min chart.
The currency pair has also plunged several levels below the 100-hour moving average, pushing it closer to the oversold conditions of the 14-hour RSI. Therefore a rebound could be imminent.
USD/JPY Fundamentals Overview

From a fundamental perspective, the USD/JPY currency pair is trading at the back of a relatively busy period in both markets. On Friday, Japan’s preliminary Jibun Bank Manufacturing PMI for October beat the expectation of 51.4 with 53. Earlier in the week, the country’s National Consumer Price Index for September beat the (YoY) expectation of -0.8% with a change of 0.2%. On the other hand, National CPI ex-food and energy missed -0.2% with -0.5%, while National CPI ex-fresh food was in line with 0.1%. Japan’s Imports and Exports for September outperformed expectations on Tuesday.
In the US, the preliminary US Markit Manufacturing PMI for October missed the expectation of 60.3 with 59.2 on Friday. On the other hand, the Services PMI beat 55.1 with 58.2, while the PMI composite outshone 54.7 with 57.3. On Thursday, the initial jobless claims for last week outperformed 300k with 290k while the continuing claims for the preceding week beat 2.55 million with 2.481 million.
USD/JPY Technical Analysis (the 60-min Chart)
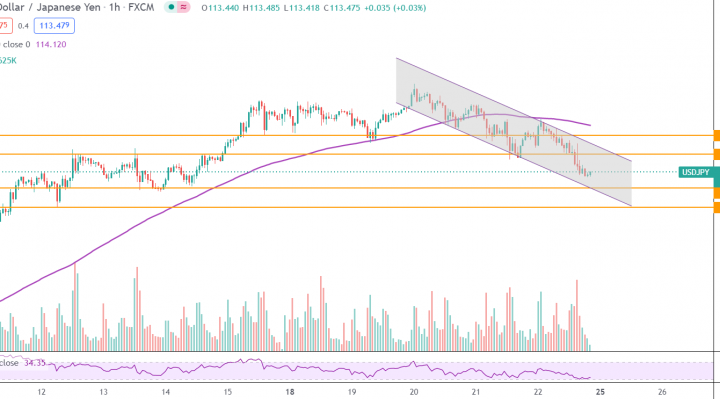
Technically, the USD/JPY currency pair appears to be trading within a descending channel formation in the 60-min chart. This indicates a significant short-term bearish bias in the market sentiment.
Therefore, the bears will be looking to stretch the current declines towards 113.250 or lower to 112.986. On the other hand, the bulls will target potential rebounds at about 113.719 or higher at 113.984.
USD/JPY Technical Analysis (the Daily Chart)
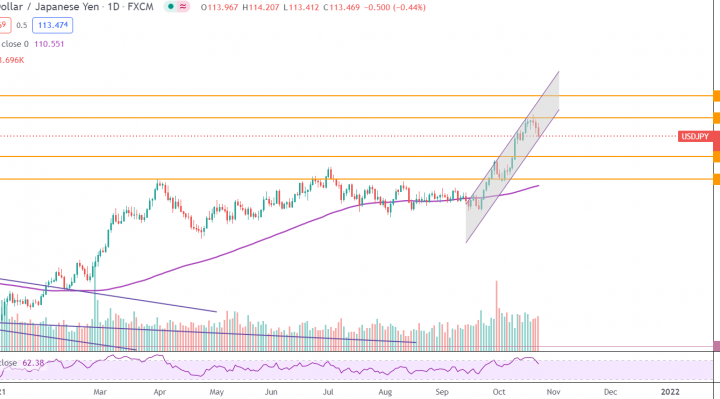
In the daily chart, the USD/JPY currency pair seems to be trading within a sharply ascending channel formation. This indicates a strong long-term bullish bias in the market sentiment.
Therefore, the bulls will be looking to ride the current bull-run towards 114.513 or higher to 115.801. On the other hand, the bears will target long-term pullbacks at about 112.261 or lower at 110.936.