
The USD/JPY currency pair on Friday plunged to trade at the current weekly lows of about 109.320 before bouncing back late on to close at 109.481. The currency pair continues to trade within a volatile ascending channel formation in the 60-min chart.
The pair remained pinned below the 100-hour moving average despite the late rebound. But it came closer to bouncing back to the normal trading zone of the 14-hour RSI.
USD/JPY Fundamentals Overview

From a fundamental perspective, the USD/JPY currency pair is trading at the back of a relatively busy period in the US market. On Friday the Us jobs data for May missed the expected job count of 650k with 559k. The unemployment rate impressed after falling to 5.8% down from 6.1% in April. The market was expecting a rate of 5.9%.
On The other hand, the average hourly wage growth for the month came in at 2% compared to an expected (YoY) change of -0.4%. Earlier in the week, the ISM manufacturing PMI beat 60.7 with 61.2. The ISM Services also outshone 63 with 64 while the ADP employment change came in stronger with 978k versus an expectation of 650k.
In Japan, Overall household spending for April beat the expected (YoY) change of 9.3% with 13% on Thursday. Earlier in the week, preliminary industrial production for April beat the expected 9Yoy) change of 3.5% with 15%.4.
USD/JPY Technical Analysis (the 60-min Chart)
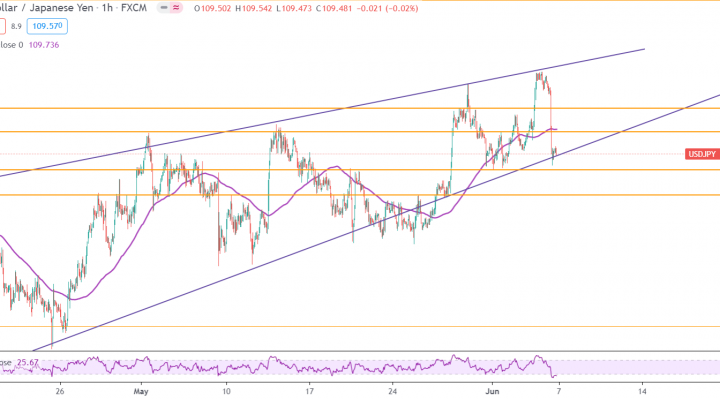
Technically, the USD/JPY currency pair appears to be trading within an ascending wedge formation in the 60-min chart. The pair has recently pulled back to trade at 109.481. It is now in oversold levels of the 14-hour RSI. This could trigger a short-term rebound.
The bulls will be looking to pounce for rebound profits at around 109.706 or higher at 109.951. On the other hand, the bears will look to profit from pullbacks around 109.321 or lower at 109.058.
USD/JPY Technical Analysis (the Daily Chart)
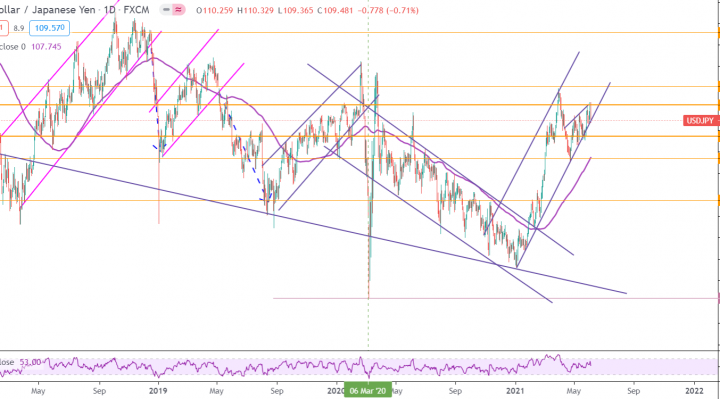
In the daily chart, the USD/JPY currency pair appears to be trading within a sharply ascending channel formation. The pair has now surged close to the overbought levels of the 14-day RSI. This shows a strong bullish bias in the market sentiment.
The bulls will look to ride the current bull-run by targeting profits at around 110.198 or higher at 111.065. On the other hand, the bears will look to pounce on potential pullbacks by targeting profits at around 108.735 or lower at 107.709.