
On Friday, the USD/JPY currency pair pulled back off the session highs of about 147.80 to trade at about 146.69. The currency pair trades within an ascending channel formation in the 60-minute chart.
Friday’s pullback pushed the pair closer to the 100-hour moving average line. However, the currency pair still seems to have room left to run before reaching the oversold levels of the 14-hour RSI.
USD/JPY Fundamentals Overview

From a fundamental perspective, the USD/JPY currency pair trades during a relatively busy period in both markets. On Thursday, the US initial jobless claims for the week ending August 2 beat the forecasted claim count of 240k with a significantly lower tally of 233k, while the continuing claims for the preceding week missed 1.87 million with a slightly higher tally of 1.875 million.
Earlier in the week, the ISM Services PMI for July beat the forecast of 51 with a reading of 51.4, while the ISM Services Prices Paid beat 55.8 with 57. On the other hand, the ISM Services employment index for the period outshone the estimate of 46.5 with 51.1.
In Japan, the eco watchers survey for the current period missed 47.8 with a reading of 47.5, while the preliminary leading economic index for June fell short of 109.3 with a reading of 108.6. The Bank Lending rate for July remained unchanged at 3.2% (YoY) in line with expectations.
Elsewhere, labour cash earnings for June exceeded the (YoY) forecast of 2.3% with a change of 4.5%, while the overall household spending for the period missed -0.9% with a change of -1.4% (YoY).
USD/JPY Technical Analysis (the 60-min Chart)
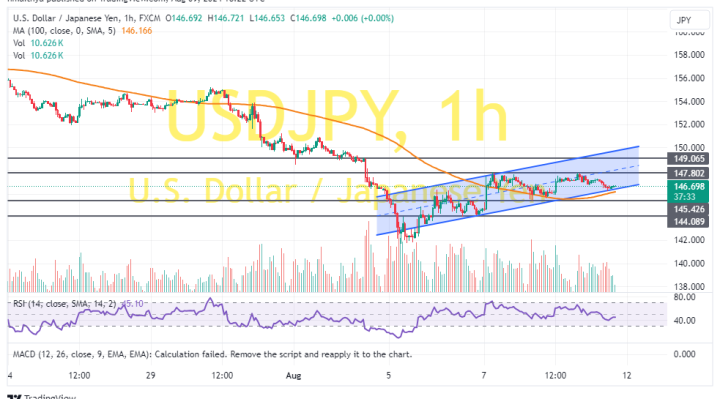
Technically, the USD/JPY currency pair trades within an ascending channel formation in the 60-minute chart. The 14-hour RSI still seems to have room left to run before reaching the oversold conditions.
Therefore, the bears will look to extend the current decline toward 145.42 or lower to 144.09. On the other hand, the bulls will look to pounce on rebounds at 147.80 or higher at 149.06.
USD/JPY Technical Analysis (the Daily Chart)
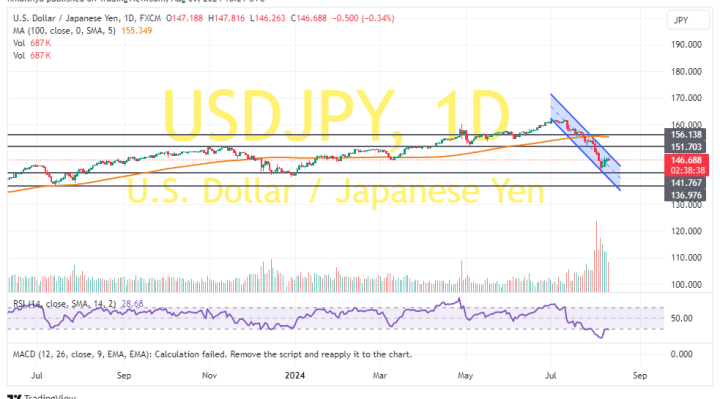
In the daily chart, the USD/JPY currency pair trades within a descending channel formation. However, the 14-day RSI has recently bounced back to recover from oversold conditions.
Therefore, the bulls will look to extend the current rebound toward 151.70 or higher to 156.13. On the other hand, the bears will look to ride the current run of declines toward 141.76 or lower to 136.97.