
On Friday, the USD/JPY currency pair pulled back from the session highs of about 156.95 to trade at about 156.65. The currency pair trades within an ascending channel formation in the 60-minute chart.
The pair has now fallen to trade a few levels below the 100-hour moving average line. However, the currency pair still has plenty of room left to run before reaching the oversold levels of the 14-hour RSI.
USD/JPY Fundamentals Overview

From a fundamental perspective, the USD/JPY currency pair trades during a relatively busy period in the US market. In Japan, labor cash earnings for March missed the expected (YoY) change of 3.2%, with a change of 2.7%.
In the US, nonfarm payrolls for April came in better than expected, with 115k versus a forecast of 62k, down from the previous month’s equivalent of 185k. The average hourly wage growth missed the expected (MoM) change of 0.3%, with a change of 0.2%. The (YoY) equivalent also fell short of 3.8%, with a change of 3.6%. The unemployment rate for the period matched the forecast of 4.3%, unchanged from the previous month.
Elsewhere, the preliminary Michigan Consumer Sentiment Index for May missed the expected reading of 49.5, with a reading of 48.2, down from the previous month’s equivalent of 49.8. The preliminary Michigan Consumer Expectations Index improved to 48.5, up from 48.1. Earlier in the week, the US initial jobless claims for last week increased to 200k, up from 190k in the preceding week, beating the forecasted claim count of 205k.
USD/JPY Technical Analysis (the 60-min Chart)
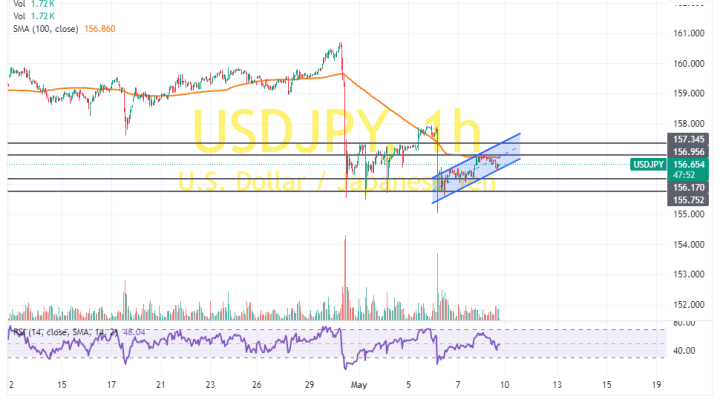
Technically, the USD/JPY currency pair trades within an ascending channel formation in the 60-minute chart. However, the 14-hour RSI has recently pulled back to avoid rallying into overbought conditions.
Therefore, the bears will look to extend the latest pullback towards 156.17 or lower to 155.75. On the other hand, the bulls will look to pounce on profits at about 156.95 or higher at 157.34.
USD/JPY Technical Analysis (the Daily Chart)
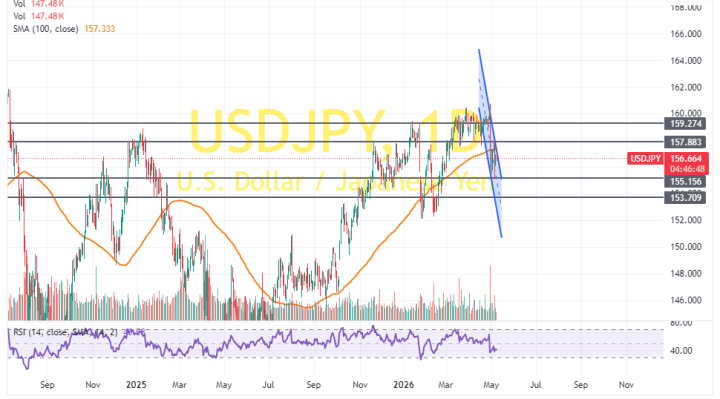
In the daily chart, the USD/JPY currency pair trades within a sharply descending channel formation. However, the 14-day RSI still has room left to run before reaching oversold conditions.
Therefore, the bears will look to extend the latest pullback towards 155.15 or lower to 153.71. On the other hand, the bulls will look to pounce on rebounds at about 157.88 or higher at 159.27.