
The USD/JPY currency pair on Friday pulled back off the current 9-month highs of about 146.58 to trade at about 146.37. The currency pair continues to trade within an ascending channel formation in the 60-min chart.
The pair has now ascended to trade several levels above the 100-hour moving average line. However, Friday’s late pullback prevented the currency pair from rallying into the overbought levels of the 14-hour RSI.
USD/JPY Fundamentals Overview

From a fundamental perspective, the USD/JPY currency pair is trading at the back of a relatively busy period in both markets. On Friday, the Michigan consumer sentiment index for August missed the expected reading of 71.2 with a reading of 69.5. The UoM 5-year consumer inflation expectation for the month outperformed the expected rate of 2.9% with a rate of 3%. On Thursday, the durable goods orders for July missed the estimated change of -4% with a change of -5.2%, while the durable goods orders ex-transportation outshone the forecasted change of 0.2% with a change of 0.5%.
In Japan, the Tokyo consumer price index for August fell short of the estimated (YoY) rate of 3% with a rate of 2.9%. The CPI ex-fresh food also missed the expectation of 2.9% with a change of 2.8% (YoY), while the CPI ex-food and energy remained unchanged at 4%. The corporate services price index for July increased to 1.7% up from 1.4% in the previous update.
USD/JPY Technical Analysis (the 60-min Chart)
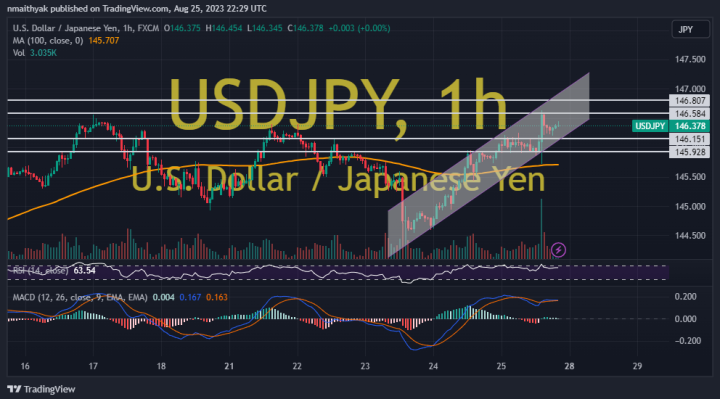
Technically, the USD/JPY currency pair appears to be trading within an ascending channel formation in the 60-min chart. The 1-hour MACD appears to indicate a lack of a clear directional bias despite the recent rebound.
Therefore, the bears will be targeting potential pullbacks at about 146.15 or lower at 145.92. On the other hand, the bulls will look to pounce on profits at about 146.58 or higher at 146.80.
USD/JPY Technical Analysis (the Daily Chart)

In the daily chart, the USD/JPY currency pair also appears to be trading within an ascending channel formation. However, the daily MACD seems to indicate a potential pullback amid a potential downward crossover.
Therefore, the bears will be targeting potential pullback profits at about 145.25 or lower at 144.06. On the other hand, the bulls will be targeting long-term profits at about 147.50 or higher at 148.75.