
The USD/JPY currency pair on Friday pulled back off the current 12-month highs of about 150.00 to trade at about 149.78. The currency pair appears to be trading within a gently ascending channel formation in the 60-minute chart.
Friday’s late pullback pushed the currency pair to the 100-hour moving average line. As a result, the pair appears to be moving closer to the oversold levels of the 14-hour RSI.
USD/JPY Fundamentals Overview

From a fundamental perspective, the USD/JPY currency pair is trading at the back of a relatively busy period in both markets. On Thursday, Japan’s National Consumer Price Index ex-fresh food for September outperformed the expectation of 2.7% with a (YoY) change of 2.8%, down from 3.1%.
Earlier in the week, exports for September beat the forecasted (YoY) change of 3.1% with a change of 4.3%, while imports for the period missed -12.9% with a change of -16.3%. The total merchandise trade balance for September came in at 62.4 billion yen, ahead of the forecasted balance of -425 billion yen, up from -937.8 billion yen.
In the US, the Philadelphia Fed Manufacturing Survey for October missed the forecast of -6.6 with -9. On the other hand, existing home sales for September beat 3.89 million with a tally of 3.86 million. The initial jobless claims for the week ending October 13 outshone the expected claim count of 212k with a tally of 198k, while the continuing claims for the preceding week missed 1.71 million with 1.734 million.
Elsewhere, building permits for September beat the estimate of 1.45 million with 1.475 million, while housing starts for the period fell short of 1.38 million with 1.358 million.
USD/JPY Technical Analysis (the 60-min Chart)
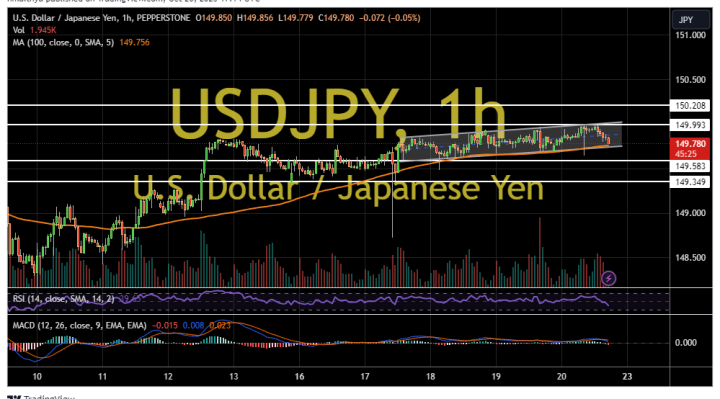
Technically, the USD/JPY currency pair appears to be trading within a gently ascending channel formation in the 60-min chart. The hourly MACD also appears to be struggling for momentum in a slightly bullish sentiment.
Therefore, the bulls will be targeting profits at about 150.00 or higher at 150.21. On the other hand, the bears will look to pounce on potential pullbacks at about 149.58 or lower at 149.35.
USD/JPY Technical Analysis (the Daily Chart)
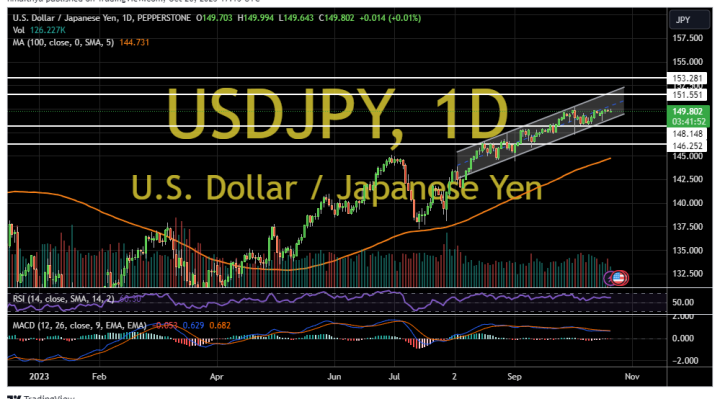
In the daily chart, the USD/JPY currency pair appears to be trading within an ascending channel formation. However, the daily MACD seems to be struggling for momentum as it attempts a potential crossover.
Therefore, the bulls will be targeting long-term profits at about 151.55 or higher at 153.28. On the other hand, the bears will look to pounce on profits at about 148.15 or lower at 146.25.