
On Thursday, the USD/JPY currency pair pulled back off the session highs of about 143.94 to trade at about 142.53. The currency pair trades within an ascending channel formation in the 60-minute chart.
Despite the pullback, the pair continues to trade above the 100-hour moving average line. Thursday’s pullback prevented the currency pair from advancing into the overbought levels of the 14-hour RSI.
USD/JPY Fundamentals Overview

From a fundamental perspective, the USD/JPY currency pair trades during a relatively busy period in both markets. On Thursday, the US initial jobless claims for the week ending September 13 edged lower 219k, down from 219k in the preceding week, beating the forecast of 230k. The Philadelphia Fed Manufacturing Survey for September also outshone the forecasted reading of -1 with a reading of 1.7, up from the preceding month’s equivalent of -7.
On Wednesday, the Federal Reserve cut the base interest rate by 50 basis points to 5%, down from 5.5%. Analysts were expecting a rate cut of 25 basis points to 5.25%. Building permits for August beat 1.41 million with 1.475 million (MoM), while housing starts for the period outshone 1.31 million with 1.356 million (MoM).
In Japan, exports for August missed the expected (YoY) change of 10% with a change of 5.6%, down from 10.2% in the preceding period. Imports also fell short of 13.4% with a change of 2.3% (YoY), down from 16.6% in the previous update. Traders will be looking forward to the Japanese National CPI data late on Thursday.
USD/JPY Technical Analysis (the 60-min Chart)
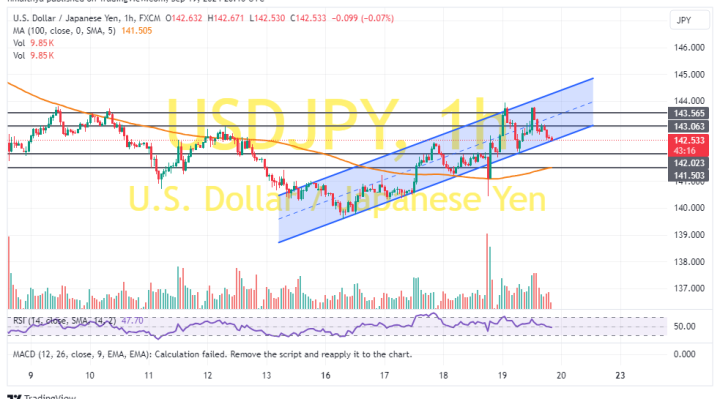
Technically, the USD/JPY currency pair trades within an ascending channel formation in the 60-minute chart. However, the 14-hour RSI has pulled back to avoid rallying into overbought conditions.
Therefore the bears will be targeting extended pullbacks to about 142.02 or lower at 141.50. On the other hand, the bulls will look to pounce on profits at about 143.06 or higher at 143.56.
USD/JPY Technical Analysis (the Daily Chart)
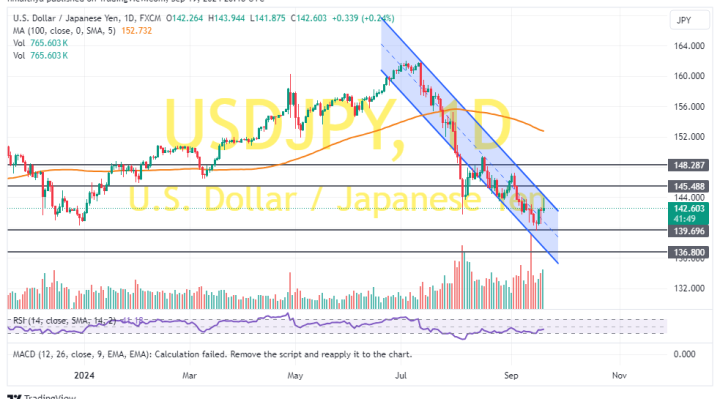
In the daily chart, the USD/JPY currency pair trades within a descending channel formation. However, the 14-day RSI has recently bounced back to avoid falling into oversold conditions.
Therefore, the bulls will look to extend the current rebound towards 145.48 or higher to 148.28. On the other hand, the bears will look to pounce on pullbacks at about 139.69 or lower at 136.80.