
The USD/JPY currency pair on Friday pulled back off the session highs of about 150.40 to trade at about 149.56. The currency pair appears to be trading within a descending channel formation in the 60-min chart.
The pair has now fallen to trade a few levels below the 100-hour moving average line. As a result, the currency pair appears to have broken into the oversold levels of the 14-hour RSI.
USD/JPY Fundamentals Overview

From a fundamental perspective, the USD/JPY currency pair is trading at the back of a relatively busy period in both markets. On Thursday, the Tokyo consumer price index ex-fresh food for October outperformed the expectation of 2.5% with a change of 2.7% (YoY). The CPI ex-food and energy was increased by 3.8% (YoY) compared to an equivalent of 3.9% registered in the previous update, while the general CPI was up 3.3% versus 2.8% in the previous update.
Earlier in the week, the Japanese corporate services price index for September beat the (YoY) forecast of 2% with a change of 2.1%, while the leading economic index for August missed 109.5 with a reading of 109.2.
In the US, the personal consumption expenditures price index for September beat the (MoM) estimate of 0.3% with a change of 0.4%. The (YoY) equivalent was in line with the forecast of 3.4%. The core personal consumption expenditures price index for the period also matched the (MoM) and (YoY) expectations of 0.3% and 3.7%, respectively. Elsewhere, personal income for September missed 0.4% with a change of 0.3%, while personal spending beat 0.2% with a change of 0.7%.
USD/JPY Technical Analysis (the 60-min Chart)
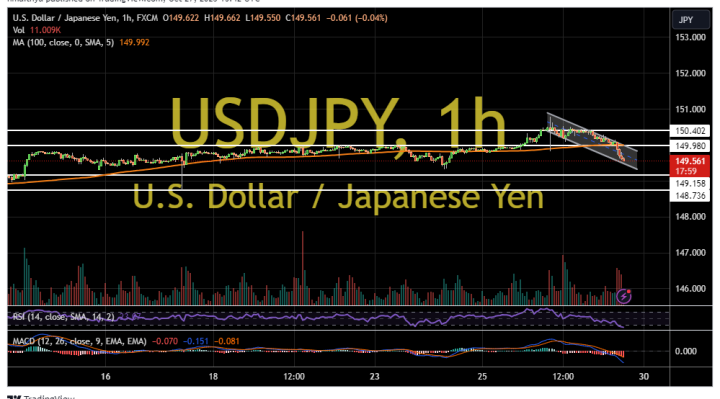
Technically, the USD/JPY currency pair appears to be trading within a descending channel formation in the 60-minute chart. The hourly MACD also seems to support the bearish bias after completing a downward crossover.
Therefore, the bears will be looking to extend the current run of declines toward 149.15 or lower to 148.73. On the other hand, the bulls will look to pounce on profits at about 149.98 or higher at 150.40.
USD/JPY Technical Analysis (the Daily Chart)
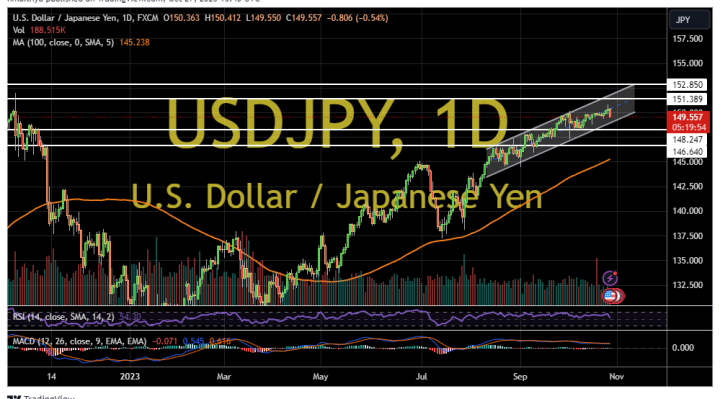
In the daily chart, the USD/JPY currency pair appears to be trading within an ascending channel formation. However, the daily MACD seems to be running out of steam as it attempts a downward crossover.
Therefore, the bears will be targeting potential pullbacks at about 148.24 or lower at 146.64. On the other hand, the bulls will be targeting long-term profits at about 151.39 or higher at 152.85.