
On Friday, the USD/JPY currency pair pulled back from the session highs of about 150.74 to trade at about 149.96 after the latest US data. The currency pair trades within a descending channel formation in the 60-minute chart.
The pair has now fallen to trade slightly below the 100-hour moving average line. However, the currency pair made a late rebound and avoided falling into the oversold levels of the 14-hour RSI.
USD/JPY Fundamentals Overview

From a fundamental perspective, the USD/JPY currency pair trades during a relatively busy period in the U.S. market. On Friday, the U.S. jobs data for November came in stronger than expected with 227k, versus a forecast of 200k, up from 36k in October. The average hourly wage growth for the month also outshone the expected (MoM) and (YoY) changes of 0.3% and 3.9%, respectively with changes of 0.4% and 4%.
On the other hand, the unemployment rate for the period was in line with the estimate of 4.2%, up from 4.1%. Elsewhere, the preliminary Michigan Consumer Sentiment Index for December rose to 74, up from 71.8, beating the forecast of 73. The UoM 5-year consumer inflation expectation for the month edged slightly lower to 3.1%, down from 3.2%.
Earlier in the week, the U.S. initial jobless claims for the week ending November 29 increased to 224k, up from 215k, missing the forecast of 215k. The ADP employment change for November also fell short of the forecasted change of 150k with 146k, down from 184k in October. In Japan, labour cash earnings for October matched the (YoY) expectation of 2.6%, up from 2.5% in September.
USD/JPY Technical Analysis (the 60-min Chart)
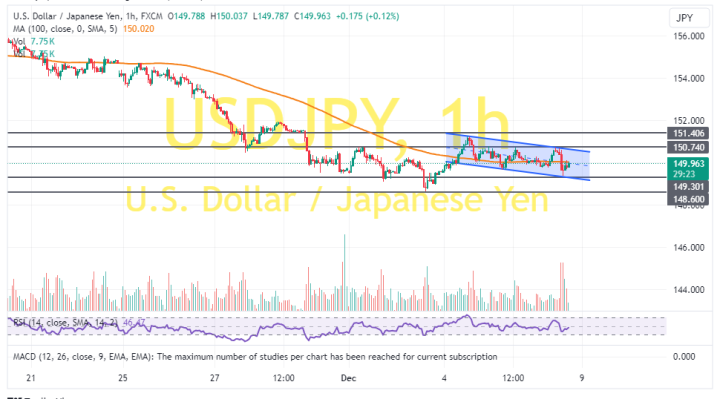
Technically, the USD/JPY currency pair trades within a descending channel formation in the 60-minute chart. The 14-hour RSI has also pulled back to move closer to the oversold conditions.
Therefore, the bears will look to extend the current pullback towards 149.30 or lower to 148.60. On the other hand, the bulls will look to pounce on profits at about 150.74 or higher at 151.40.
USD/JPY Technical Analysis (the Daily Chart)
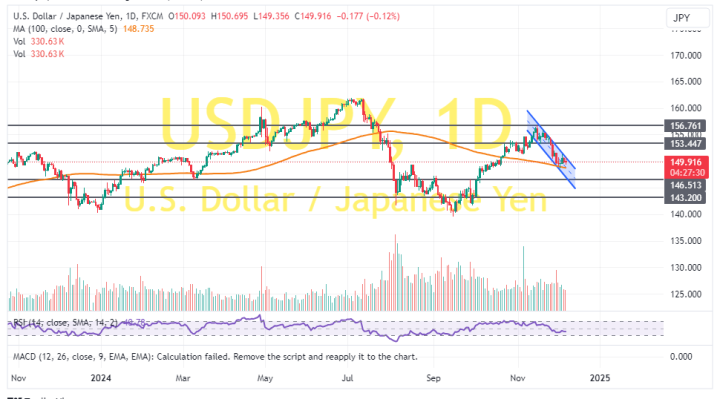
In the daily chart, the USD/JPY currency pair trades within a descending channel formation. The 14-day RSI also supports a downward movement as it edges closer to oversold conditions.
Therefore, the bears will be targeting long-term declines at about 146.51 or lower at 143.20. On the other hand, the bulls will look to pounce on rebounds at about 153.44 or higher at 156.76.