
On Thursday, the USD/JPY currency pair pulled back from the session highs of about 152.92 to trade at about 152.00. The currency pair trades within a descending channel formation in the 60-minute chart.
The pair has now plummeted to trade several levels below the 100-hour moving average line. The currency pair bounced back late on Thursday to avoid falling into the oversold levels of the 14-hour RSI.
USD/JPY Fundamentals Overview

From a fundamental perspective, the USD/JPY currency pair trades during a relatively busy period in the U.S. market. On Thursday, the U.S. initial jobless claims for the week ending January 31 missed the expectation of 213k with a significantly higher tally of 219k, up from the preceding week’s equivalent of 208k.
The preliminary U.S. nonfarm productivity for Q4 also missed the forecasted change of 1.7% with a change of 1.2%, while the preliminary unit labour costs for the period fell short of 3.8% with a change of 3%.
On Wednesday, the ADP Employment Change for January exceeded expectations of 150k with a change of 183k. The S&P Global Composite PMI for the month also beat 52.4 with a reading of 52.7, while the ISM Services PMI fell short of 54.3 with a reading of 52.8.
In Japan, labour cash earnings for December outperformed the (YoY) forecast of 3.8% with a change of 4.8%. Traders will be looking forward to the U.S. nonfarm payrolls data for January on Friday.
USD/JPY Technical Analysis (the 60-min Chart)
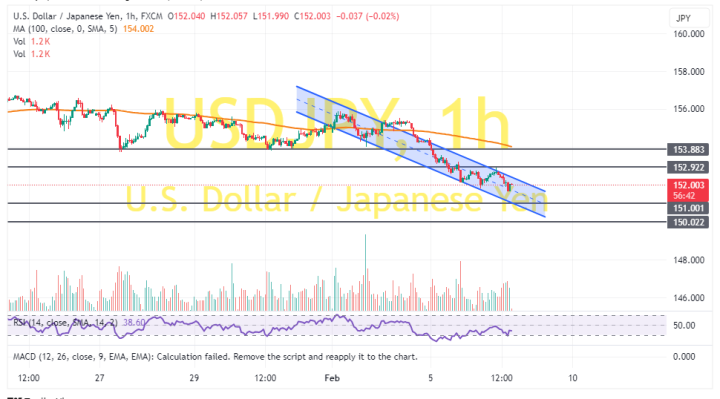
Technically, the USD/JPY currency pair trades within a descending channel formation in the 60-minute chart. The 14-hour RSI also supports a bearish bias as it remains closer to the oversold conditions.
Therefore, the bears will look to ride the current decline towards 151.00 or lower to 150.00. On the other hand, the bulls will look to pounce on rebounds at about 152.92 or higher at 153.88.
USD/JPY Technical Analysis (the Daily Chart)
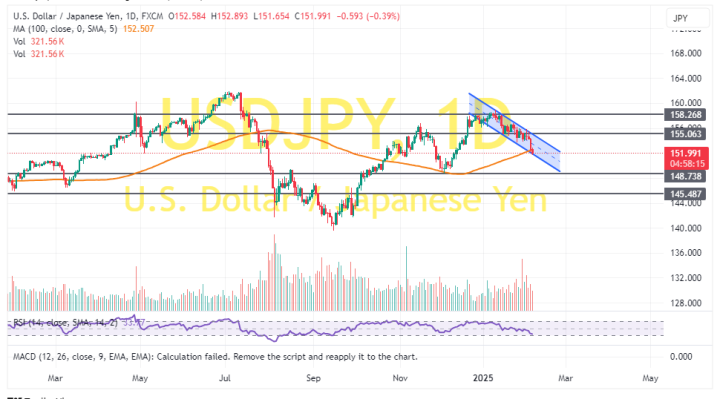
In the daily chart, the USD/JPY also trades within a descending channel formation. The 14-day RSI continues to support a bearish bias as it moves closer to the oversold conditions.
Therefore, the bears will be targeting long-term declines at about 148.73 or lower at 145.48. On the other hand, the bulls will look to pounce on profits at about 155.06 or higher at 158.26.