
On Friday, the USD/JPY currency pair pulled back from the session highs of about 156.57 to trade at about 155.63. The currency pair trades within a highly volatile sideways channel formation in the 60-minute chart.
Friday’s pullback pushed the currency pair slightly below the 100-hour moving average line. As a result, the currency pair avoided rallying into the overbought levels of the 14-hour RSI.
USD/JPY Fundamentals Overview

From a fundamental perspective, the USD/JPY currency pair trades during a relatively busy period in both markets. On Friday, the preliminary U.S. S&P Global Manufacturing PMI for January came in stronger than expected with 50.1 versus a forecast of 49.6. The preliminary S&P Global Services PMI for the period also missed 56.5 with 52.8.
On the other hand, the Michigan Consumer Sentiment Index for January fell short of 73.2 with a reading of 71.1, while the UoM 5-year consumer inflation expectations for the month missed 3.3% with a rate of 3.2%.
In Japan, the Bank of Japan hiked the base interest rate by 25 basis points to 0.5%, up from 0.25%, in line with expectations. The national consumer price index for the country for December improved to 3.6% up from 2.9% in November.
The CPI ex-food and energy for the period was unchanged at 2.4%, while the CPI ex-fresh food improved to 3%, up from 2.7%, in line with forecasts. Japanese exports for December exceeded the (YoY) expectation of 2.3% with a change of 2.8%, while imports for the period fell short of 2.6% with a change of 1.8% (YoY).
USD/JPY Technical Analysis (the 60-min Chart)
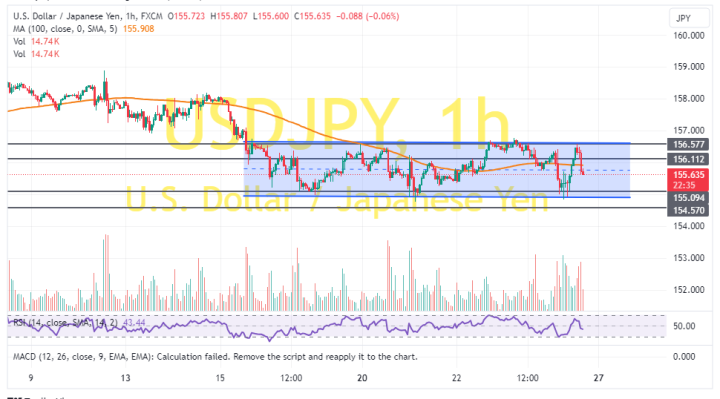
Technically, the USD/JPY currency pair trades within a sideways channel formation in the 60-minute chart. The 14-hour RSI has recently pulled back to avoid rallying into the overbought conditions.
Therefore, the bears will look to stretch the current pullback towards 155.09 or lower to 154.57. On the other hand, the bulls will look to pounce on upward movements at about 156.11 or higher at 156.57.
USD/JPY Technical Analysis (the Daily Chart)
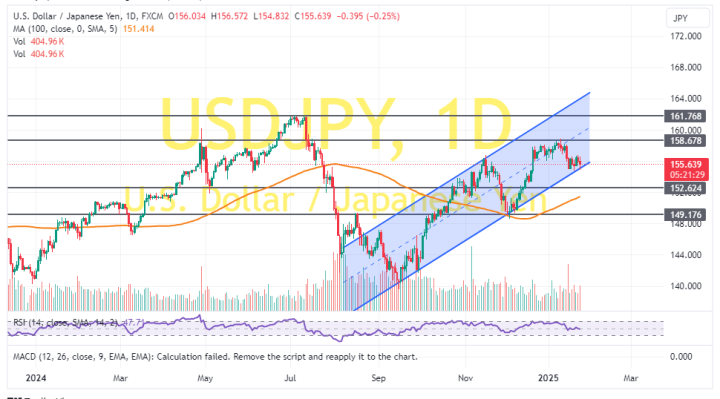
In the daily chart, the USD/JPY currency pair trades within an ascending channel formation. However, the 14-day RSI has recently pulled back to avoid entering the overbought conditions.
Therefore, the bears will be targeting extended pullbacks at about 152.62 or lower at 149.17. On the other hand, the bulls will look to ride the current rally towards 158.67 or higher to 161.76.