
On Friday, the USD/JPY currency pair pulled back from the session highs of about 156.24 to trade at about 155.89 after the latest data. The currency pair trades within an ascending channel formation in the 60-minute chart.
The pair continues to trade slightly above the 100-hour moving average line, despite the latest pullback. As a result, it still has some room left to run before reaching the oversold levels of the 14-hour RSI.
USD/JPY Fundamentals Overview

From a fundamental perspective, the USD/JPY currency pair trades during a relatively busy period in both markets. On Friday, Japan’s retail trade for January outperformed the expected (YoY) change of -0.4%, with a change of 1.8%. The Tokyo consumer price index for February rose to 1.6%, up from 1.5%, while the Tokyo CPI ex-food and energy fell to 1.8%, down from 2%. The Tokyo CPI ex-fresh food for the month also edged slightly lower to 1.8%, down from 2% in January, beating the forecasted rate of 1.7%.
Large retail sales for January delivered a change of 3% versus a forecast of 2%, while the seasonally-adjusted retail sales for the period grew by 4.1% compared to a decline of 2% in the previous period.
In the US, the initial jobless claims for last week increased to 212k, up from the previous week’s claim count of 208k, but still below the forecast of 215k. The housing price index for December fell short of the forecasted (MoM) change of 0.3%, with a change of 0.1%.
The S&P/Case-Shiller Home Price Indices for the month also missed the expected change of 1.5%, with a change of 1.4%, while the factory orders for the period missed 1.1%, with a change of -0.7%.
USD/JPY Technical Analysis (the 60-min Chart)
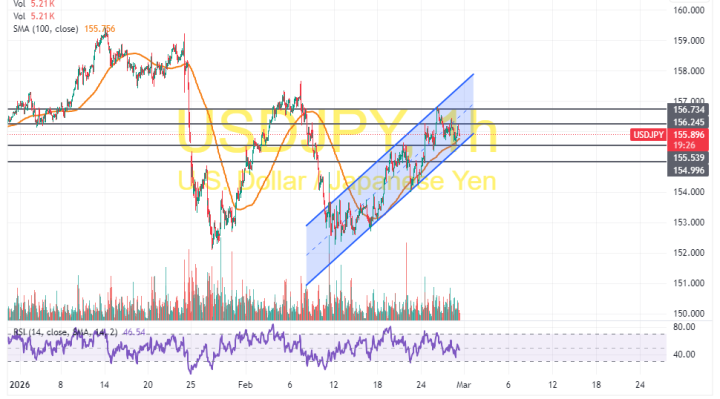
Technically, the USD/JPY currency pair trades within an ascending channel formation in the 60-minute chart. However, the 14-hour RSI has recently pulled back to avoid rallying into overbought conditions.
Therefore, the bears will look to extend the latest pullback towards 155.54 or lower to 154.99. On the other hand, the bulls will look to pounce on profits at about 156.24 or higher at 156.73.
USD/JPY Technical Analysis (the Daily Chart)
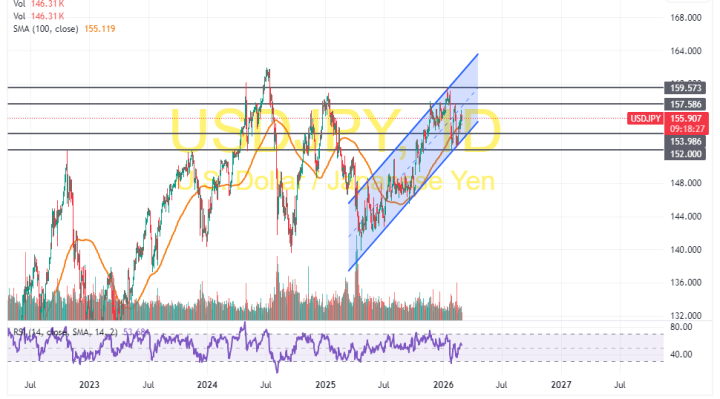
In the daily chart, the USD/JPY currency pair trades within an ascending channel formation. The 14-day RSI also supports a long-term bullish bias after bouncing back to avoid falling into oversold conditions.
Therefore, the bulls will look to extend the latest rebound towards 157.58 or higher to 159.57. On the other hand, the bears will look to pounce on pullbacks at about 153.98 or lower at 152.00.