
On Friday, the USD/JPY currency pair pulled back from the session highs of about 159.21 to trade at about 157.37 before bouncing back to 158.19. The currency pair trades within a sideways channel formation in the 60-minute chart.
The currency pair trades at the 100-hour moving average line, following Friday’s late rebound. However, the pair continues to trade closer to the oversold levels of the 14-hour RSI.
USD/JPY Fundamentals Overview

From a fundamental perspective, the USD/JPY currency pair trades during a relatively busy period in both markets. On Friday, the Bank of Japan chose to keep the base interest rate unchanged at 0.75%, as expected. The National CPI ex-fresh food for December also matched the forecast of 2.4%.
Earlier in the week, Japanese exports for December missed the expected (YoY) change of 6.1%, with a change of 5.1%. Imports for the period outshone the forecast 3.6%, with a change of 5.3%. On the other hand, the Merchandise Trade Balance Total for the period fell to 105.7 billion yen, down from 322.2 billion yen in November, missing the forecasted trade balance total of 357 billion yen.
In the U.S., the preliminary S&P Global Manufacturing PMI for January missed the expectation of 52.1, with a reading of 51.9. The preliminary S&P Global Services PMI for the period also fell short of 52.8, with a reading of 52.5.
Personal income for November missed the expected (MoM) change of 0.4%, with a change of 0.3%, while personal spending matched the forecast of 0.5%. The personal consumption expenditures – price index for the month was also in line with the (MoM) and (YoY) forecasts of 0.2% and 2.8%, respectively.
USD/JPY Technical Analysis (the 60-min Chart)

Technically, the USD/JPY currency pair trades within a sideways channel formation in the 60-minute chart. However, the 14-hour RSI has recently pulled back to move closer to oversold conditions.
Therefore, the bears will look to stretch the latest pullback towards 157.37 or lower to 156.46. On the other hand, the bulls will look to pounce on rebounds at about 159.21 or higher at 160.13.
USD/JPY Technical Analysis (the Daily Chart)
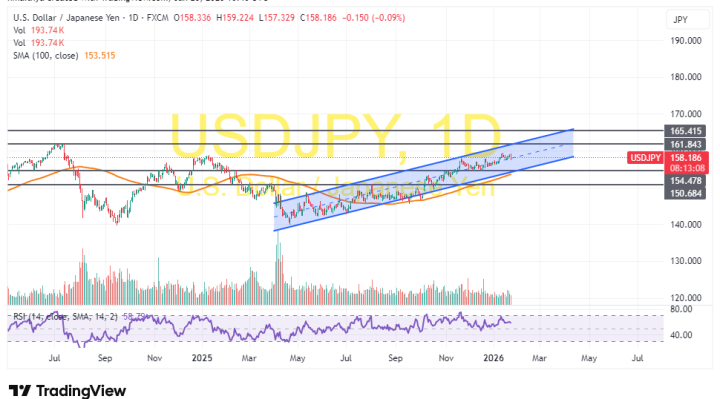
In the daily chart, the USD/JPY currency pair trades within an ascending channel formation. However, the 14-day RSI has recently pulled back to avoid entering overbought conditions.
Therefore, the bears will look to extend the latest pullback towards 154.47 or lower to 150.68. On the other hand, the bulls will look to ride the current run of gains toward 161.84 or higher to 165.41.