
On Friday, the USD/JPY currency pair pulled back from the session highs of about 158.00 to trade at about 157.76. In the 60-minute chart, the currency pair trades within an ascending channel formation.
The pair continues to trade a few levels above the 100-hour moving average line, despite the pullback. The currency pair remains pinned centrally in the 14-hour RSI, leaving enough room for the bulls and bears to pounce.
USD/JPY Fundamentals Overview

From a fundamental perspective, the USD/JPY currency pair trades during a relatively busy period in both markets. On Thursday, the Japanese retail trade for November beat the (YoY) forecast of 1.7% with a change of 2.8%, up from 1.6% in the preceding period. The seasonally adjusted retail trade improved from 0.1% to 1.8% (MoM), while large retail sales delivered a change of 3%, up from -1% (YoY).
The Tokyo Consumer Price Index for December delivered a (YoY) change of 3% compared to a change of 2.6% in the previous period. The CPI ex-food and energy improved with a change of 2.4%, up from 2.2%, the same as the CPI ex-fresh food, which missed the forecast of 2.5%.
In the U.S., the durable goods orders for November missed the expected change of -0.4% with a change of -1.1%. The durable goods orders ex-transportation also fell short of the forecasted change of 0.3% with a change of -0.1%, while the new home sales for November beat the forecast of 0.65 million with a tally of 0.664 million.
Elsewhere, the U.S. initial jobless claims for the week ending December 20 outshone the forecast of 220k with a tally of 219k, down from 224k in the preceding week.
USD/JPY Technical Analysis (the 60-min Chart)
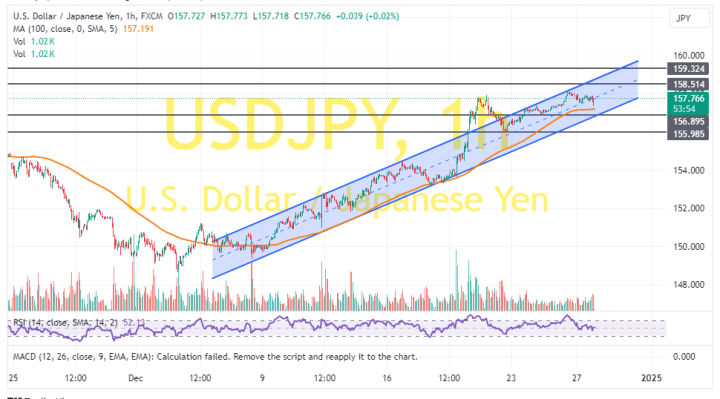
Technically, the USD/JPY currency pair trades within an ascending channel formation in the 60-minute chart. However, the 14-hour RSI has recently pulled back to recover from overbought conditions.
Therefore, the bears will look to extend the current pullback towards 156.89 or lower to 155.98. On the other hand, the bulls will look to pounce on rebounds at about 158.51 or higher at 159.32.
USD/JPY Technical Analysis (the Daily Chart)
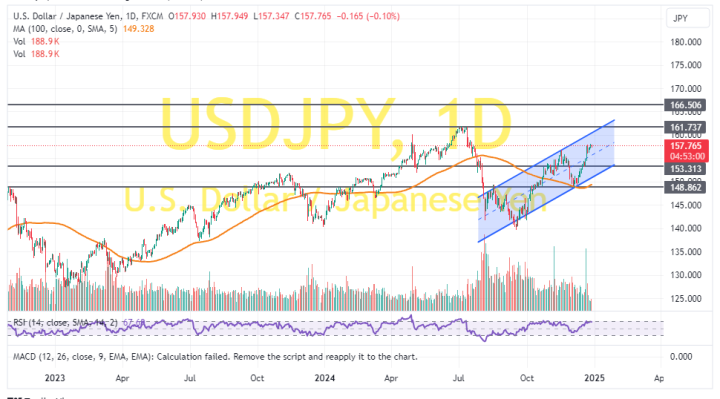
In the daily chart, the USD/JPY currency pair trades in an ascending channel formation. The 14-day RSI also supports a long-term bullish bias as it edges closer to overbought conditions.
Therefore, the bulls will look to ride the current run of gains to about 161.73 or higher to 166.50. On the other hand, the bears will look to pounce on pullbacks at about 153.31 or lower at 148.86.