
On Friday, the USD/JPY currency pair pulled back from the session high of about 158.43 to trade at about 157.92. The currency pair continues to form a double-top reversal pattern in the 60-minute chart.
The pair has now traded slightly below the 100-hour moving average line. However, the currency pair still has a lot of room left to run before reaching the oversold levels of the 14-hour RSI.
USD/JPY Fundamentals Overview

From a fundamental perspective, the USD/JPY currency pair trades during a relatively busy period in the U.S. market. On Friday, the US nonfarm payrolls for December exceeded the expected job count of 160k with a tally of 256k, up from 212k in November.
The unemployment rate for the month also improved to 4.1% down from 4.2% in the preceding month, beating the forecasted rate of 4.2%. On the other hand, the average hourly wage growth for the period missed the expected (YoY) change of 4% with a change of 3.9%, down from 4%. The (MoM) equivalent was in line with the estimate of 0.3%, also down from 0.4% in November.
Earlier in the week, the US initial jobless claims for the week ending January 3 came in lower than expected with 201k versus a forecast of 218k, down from the preceding week’s claim count of 211k. The ADP employment change for December missed the expected change of 140k with a tally of 122k, down from the preceding month’s equivalent of 146k.
On the other hand, the ISM Services PMI for the period outshone the estimate of 53.3 with a reading of 54.1, while the JOLTS job openings for November beat 7.7 million with a tally of 8.098 million.
USD/JPY Technical Analysis (the 60-min Chart)

Technically, the USD/JPY currency pair is about to complete a double-top reversal pattern formation in the 60-minute chart. The 14-hour RSI has also pulled back to avoid rallying into overbought conditions.
Therefore, the bears will look to extend the current pullback towards 157.66 or lower to 157.40. On the other hand, the bulls will look to pounce on profits at about 158.17 or higher at 158.43.
USD/JPY Technical Analysis (the Daily Chart)
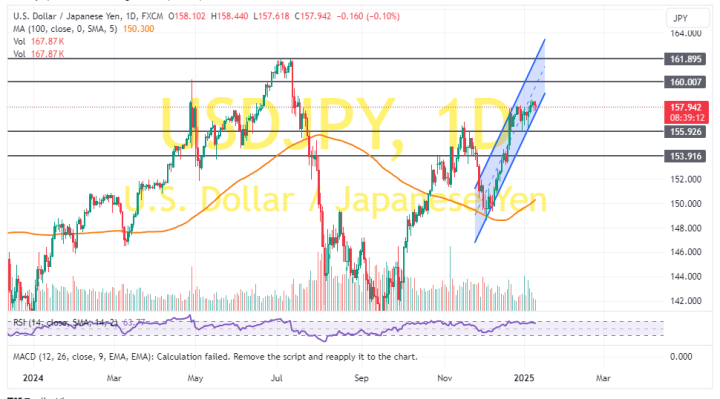
In the daily chart, the USD/JPY currency pair trades within an ascending channel formation. The 14-day RSI also supports a long-term bullish bias as it edges closer to overbought conditions.
Therefore, the bulls will look to ride the current rally towards 160.00 or higher to 161.89. On the other hand, the bears will look to pounce on pullbacks at about 155.2 or lower at 153.91.