
The USD/JPY currency pair on Friday pulled back off the session highs of about 130.561 to trade at about 129.547. The currency pair appears to have completed a downward breakout from an ascending channel formation.
The currency pair now appears to be moving towards the 100-hour MA line down below. Friday’s pullback pushed the currency pair from overbought conditions back to the normal trading zone of the 14-hour RSI.
USD/JPY Fundamentals Overview

From a fundamental perspective, the USD/JPY currency pair is trading at the back of a relatively busy period in both markets. On Friday, US existing home sales for December beat the expectation of 1.396 million with a tally of 1.402 million. The existing home sales change also outshone the forecast of -5.4% with a change of -1.5%. On Thursday, the initial jobless claims for the week ending January 13 beat the expected claim count of 214k with a lower tally of 190k, while continuing claims for the preceding week outperformed the expectation of 1.66 million with 1.647 million. The Philadelphia Fed Manufacturing Survey also outshone -11 with a reading of -8.9.
In Japan, the National CPI ex-food and energy for December beat the (YoY) expectation of 2.9% with a change of 3%. On the other hand, the National CPI for ex-fresh food matched the estimated change of 4%, while the overall National CPI missed the forecast of 4.4% with a change of 4%. Earlier in the week, imports for December missed the (YoY) estimate of 22.4% with a change of 20.6%, while exports outshone 10.1% with a change of 11.5%. Elsewhere, the BoJ kept the base interest rate unchanged at -0.1%.
USD/JPY Technical Analysis (the 60-min Chart)

Technically, the USD/JPY currency pair appears to have recently completed a downward breakout from an ascending channel formation. This indicates an abrupt change in the market sentiment from bullish to bearish.
Therefore, the bears will be looking to extend the current decline toward 128.671 or lower to 127.806. On the other hand, the bulls will look to pounce on profits at about 130.561 or higher at 131.387.
USD/JPY Technical Analysis (the Daily Chart)
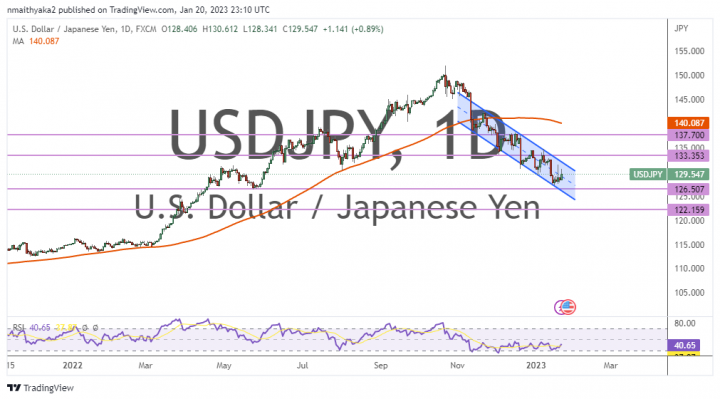
In the daily chart, the USD/JPY currency pair appears to be trading within a descending channel formation. This indicates a significant long-term bearish bias in the market sentiment.
Therefore, the bears will be targeting long-term profits at about 126.507 or lower at 122.159. On the other hand, the bulls will be targeting potential rebounds at about 133.353 or higher at 137.700.