
The USD/JPY currency pair on Friday pulled back off the trendline resistance at about 135.000 to trade at about 134.820. The currency pair continues to trade within an ascending channel formation in the 60-min chart.
The pair still remains several levels below the 100-hour moving average line despite Friday’s rally. However, it seems to have moved closer to the overbought levels of the 14-hour RSI.
USD/JPY Fundamentals Overview

From a fundamental perspective, the USD/JPY currency pair is trading at the back of a relatively busy period in the US market. On Friday, US nonfarm payrolls for April smashed the expected job tally of 179k with a higher tally of 253k.
On the other hand, the average hourly wage growth for the month increased by 4.4% (YoY) ahead of the estimated growth rate of 4.2%, while the unemployment rate for the period fell to 3.4%, down from 3.5% in March, also ahead of the expected unemployment rate of 3.5%. The labour force participation rate for April increased slightly to 62.6% up from 62.5% in March, beating the expected rate of 62.5%.
In Japan, the monetary base for April missed the expected (YoY) change of 1.1% with a change of -1.7%. On the other hand, the consumer confidence index for April beat the expected reading of 32.4 with a reading of 35.4, while the Jibun Bank Manufacturing PMI for the month matched the expected reading of 49.5.
USD/JPY Technical Analysis (the 60-min Chart)
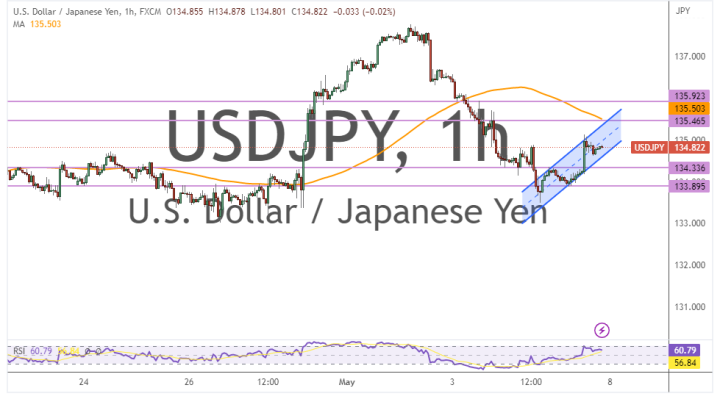
Technically, the USD/JPY currency pair appears to be trading within an ascending channel formation in the 60-min chart. This indicates a significant short-term bullish bias in the market sentiment.
Therefore, the bulls will be looking to ride the current rally towards 135.465 or higher to 135.923. On the other hand, the bears will be targeting profits at about 134.336 or lower at 133.895.
USD/JPY Technical Analysis (the Daily Chart)
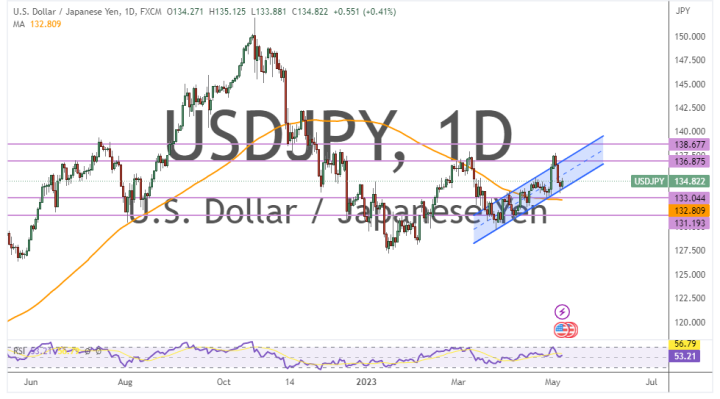
In the daily chart, the USD/JPY currency pair also appears to be trading within an ascending channel formation. This indicates a significant long-term bullish bias in the market sentiment.
Therefore, the bulls will be targeting long-term profits at about 136.875 or higher at 138.677. On the other hand, the bears will be targeting extended pullbacks at about 133.044 or lower at 131.193.