
The USD/JPY currency pair on Friday pulled back off the current weekly highs of about 107.400 to trade at around 107.000 after the Japanese interest rate decision. The currency pair has been trading within a slightly descending channel in the 60-min chart since the start of the month.
The pair has now dropped below the current levels of the 100-hour and the 200-hour SMA lines. The downward movement prevented it from crossing to overbought levels of the 14-hour RSI and pushed it closer to the oversold levels.
USD/JPY Fundamentals Overview

From a fundamental perspective, the USD/JPY currency pair is trading at the back of a relatively busy period in both the US and the Japanese markets. On Tuesday, the Japanese industrial production for May missed the (YoY) expectation of -25.9% with -26.3%. The (MoM) equivalent of -8.9% was also short of the expected change of -8.4%. On Wednesday, the Bank for Japan decided to keep the base interest rate unchanged at -0.1% in line with expectations.
In the US, consumer price index ex-food and energy for June beat the (MoM) expectation of 0.1% with a change of 0.2%. The (YoY) equivalent outshone 1.1% with a change of 1.2%. On Thursday, the retail sales control group posted a change of 5.6% for June versus an expectation of 3.6% (MoM). General retail sales also outperformed 5% with 7.5% while the (MoM) change in retail sales ex-autos of 7.3% also beat 5%. On Friday, the preliminary Michigan consumer sentiment index for July missed the expectation of 79 with 73.2. Building permits for June also disappointed with 1.241M versus 1.29M (MoM) while housing starts beat 1.169M with 1.186M.
USD/JPY Technical Analysis (the 60-min Chart)
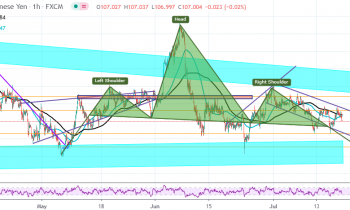
Technically, the USD/JPY currency pair appears to be trading within a descending channel in the 60-min chart. This indicates a short-term bearish bias in the market sentiment.
The bulls will be targeting short-term rebound profits at around 107.308 or higher at 107.714. On the other hand, the bears will look to extend the current downtrend towards 106.649 or lower at 106.260.
USD/JPY Technical Analysis (the Daily Chart)
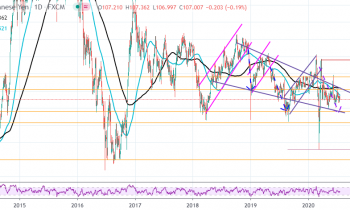
In the daily chart, the USD/JPY currency pair appears to be trading within a consolidative bearish wedge. This indicates a long-term bearish bias in the market sentiment. The pair has now dropped below the 100-day and the 200-day SMA lines.
The bears will look to extend the current declines towards 105.637 or 104.311, in the long-term. On the other hand, the bulls will target potential reversals at around 108.181 or higher at 109.543.