
The USD/JPY currency pair on Thursday pulled back from the current weekly highs of 110.409 to trade around 110.139 after the claims data. The currency still continues to trade within a gently descending channel formation in the 60-min chart.
The pair appears to have failed to complete a XABCD double-bottom reversal pattern formation as it pulls closer to the 100-hour moving average. The pair continues to trade centrally in the 14-hour RSI.
USD/JPY Fundamentals Overview

The USD/JPY currency pair is trading at the back of a relatively busy period in both markets. On Thursday, the US initial jobless claims for the week ending July 16 missed the expected claim count estimate of 350k with a higher tally of 419k. The continuing claims also came in higher than expected at 3.236 million versus 3.1 million. On the other hand, the US existing home sales for June came short of the (MoM) expectation of 5.9 million with 5.86 million. Earlier in the week, US building permits also missed expectations while new housing starts came in better than expected.
In Japan, imports for June beat the expected (YoY) change of 29% with 32.7%. Exports for the period also outperformed 46.2% with 48.6% (YoY). However, the merchandise trade balance for the period missed expectations. Earlier in the week, Japan’s national CPI ex-food and energy for June beat the expected (YoY) change of -0.5% with -0.2% while CPI ex-fresh food matched expectations at 0.2%. On the other hand, general CPI beat -0.1% with 0.2% (YoY).
USD/JPY Technical Analysis (the 60-min Chart)
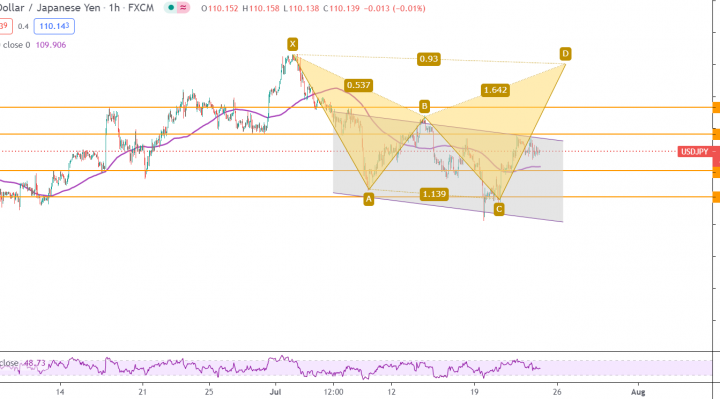
Technically, the USD/JPY currency pair appears to be trading within a descending channel formation in the 60-min chart. This shows a slight short-term bearing bias in the market sentiment.
The bulls will look to extend the latest rebound towards 110.409 or higher to 110.829. On the other hand, the bears will target short-term profits at 109.839 or lower at 109.428.
USD/JPY Technical Analysis (the Daily Chart)
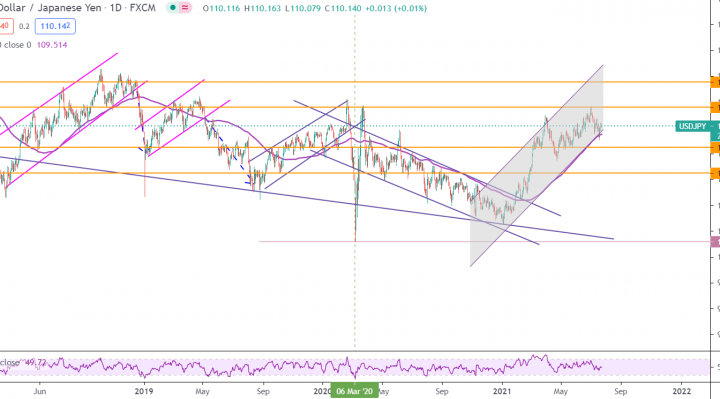
In the daily chart, the USD/JPY currency pair appears to be trading within a sharply ascending channel formation. This indicates a strong long-term bullish bias in the market sentiment.
The bulls will look to ride the current rally towards 111.607 or higher to 113.530. On the other hand, the bears will target long-term profits at around 108.495 or lower at 106.481.