
The USD/JPY currency pair attempted a rebound on Friday after the pullback witnessed over the last few days. However, that rebound appears to be facing strong resistance around 112.00 level and the pair now looks set to descend again towards the 111.260.
The two levels form what appears to be the current short-term resistance and support levels, but looking at the trendline up top, the general control appears to be with the bears.
USD/JPY Fundamentals Overview

From a fundamental perspective, the Japanese Yen failed to capitalize on some positive economic data from the Bank of Japan in the early morning hours with the greenback remaining steady ahead of the US Q1 GDP data.
Then at 12:30 GMT when the US GDP data for Q1, 2019 was announced, it surprised investors with 0.6% versus 1.3% forecast, which was also a decline from the previous quarter (1.9%).
However, the annualized figure beat expectations coming in at 3.2% versus a forecast of 2%. Core Personal Expenditure Consumption edged downwards slightly by 1.3% versus 1.8% previous while analysts expected 1.6% growth. This left the USD/JPY currency pair hanging in the balance without major movements.
USD/JPY Technical Analysis (the 240-min Chart)
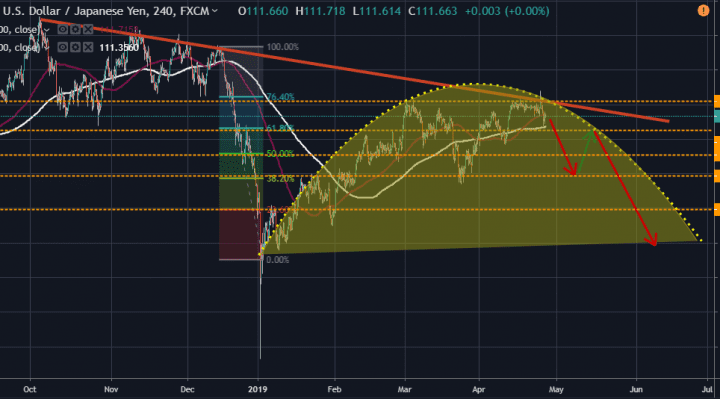
Technically, the pair appears to be facing significant resistance around the 112.00 level, which suggests that given the downward trendline at the top, the next major move could be due south.
This presents some interesting opportunities for traders as demonstrated in the 240-min chart above. The bulls will look to strike with a take profit target at around 112.00 while the bears will look for opportunities around the 110.550 level.
USD/JPY Technical Analysis (the Daily Chart)
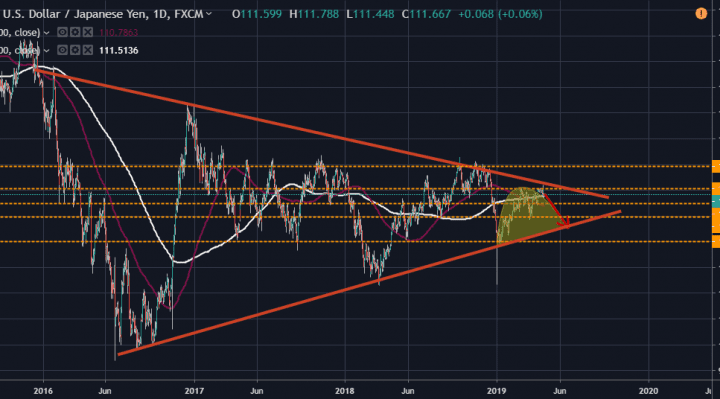
In the daily chart, the USD/JPY currency pair appears to be trading within a converging wedge, which could end up with a formation of a symmetrical triangle breakout pattern. And again, the downward pressure on the pair is very evident. However, the direction of the potential breakout could be either side.
This creates multiple trading opportunities for both the bulls and the bears although the bias appears to be bearish for now with the pair trading just between the 100-day and the 200-day moving averages.
In summary, the USD/JPY currency pair looks like it is headed for a major pullback before we can finally witness a breakout from the current wedge. The fundamentals are sending mixed signals, which will encourage consolidation around 112.00 and 110.550 levels