
The rate dropped and invalidated another important increase. Price is trading in the red on the Daily chart and most likely will close the day in the seller’s territory. The Yen has taken the lead as the USD was weakened by the USDX’s drop.
The Yen increased a little also because the Nikkei stock index has shown some exhaustion signs and could drop again. A Nikkei’s drop will force the Yen to dominate the currency market. It will be very important what will happen with the USDX, the index is somehow expected to drop after a breakdown below an important dynamic support.

The Japanese Core Machinery Orders rose by 8.2%, beating the 5.3% estimate, it has jumped in the positive territory after the 9.3% drop in the former reading period.
The US data failed to impress today, that’s why the USDX could drop further in the upcoming days, the Retail Sales dropped by 0.1%, even if the traders have expected to see a 0.3% growth, while the Core Retail Sales increased only by 0.2%, less versus the 0.4% estimate. The PPI surged by 0.2%, beating the 0.1% estimate, while the Core PPI increased by 0.2%, matching expectations. The Business Inventories surged by 0.6%, matching expectations.
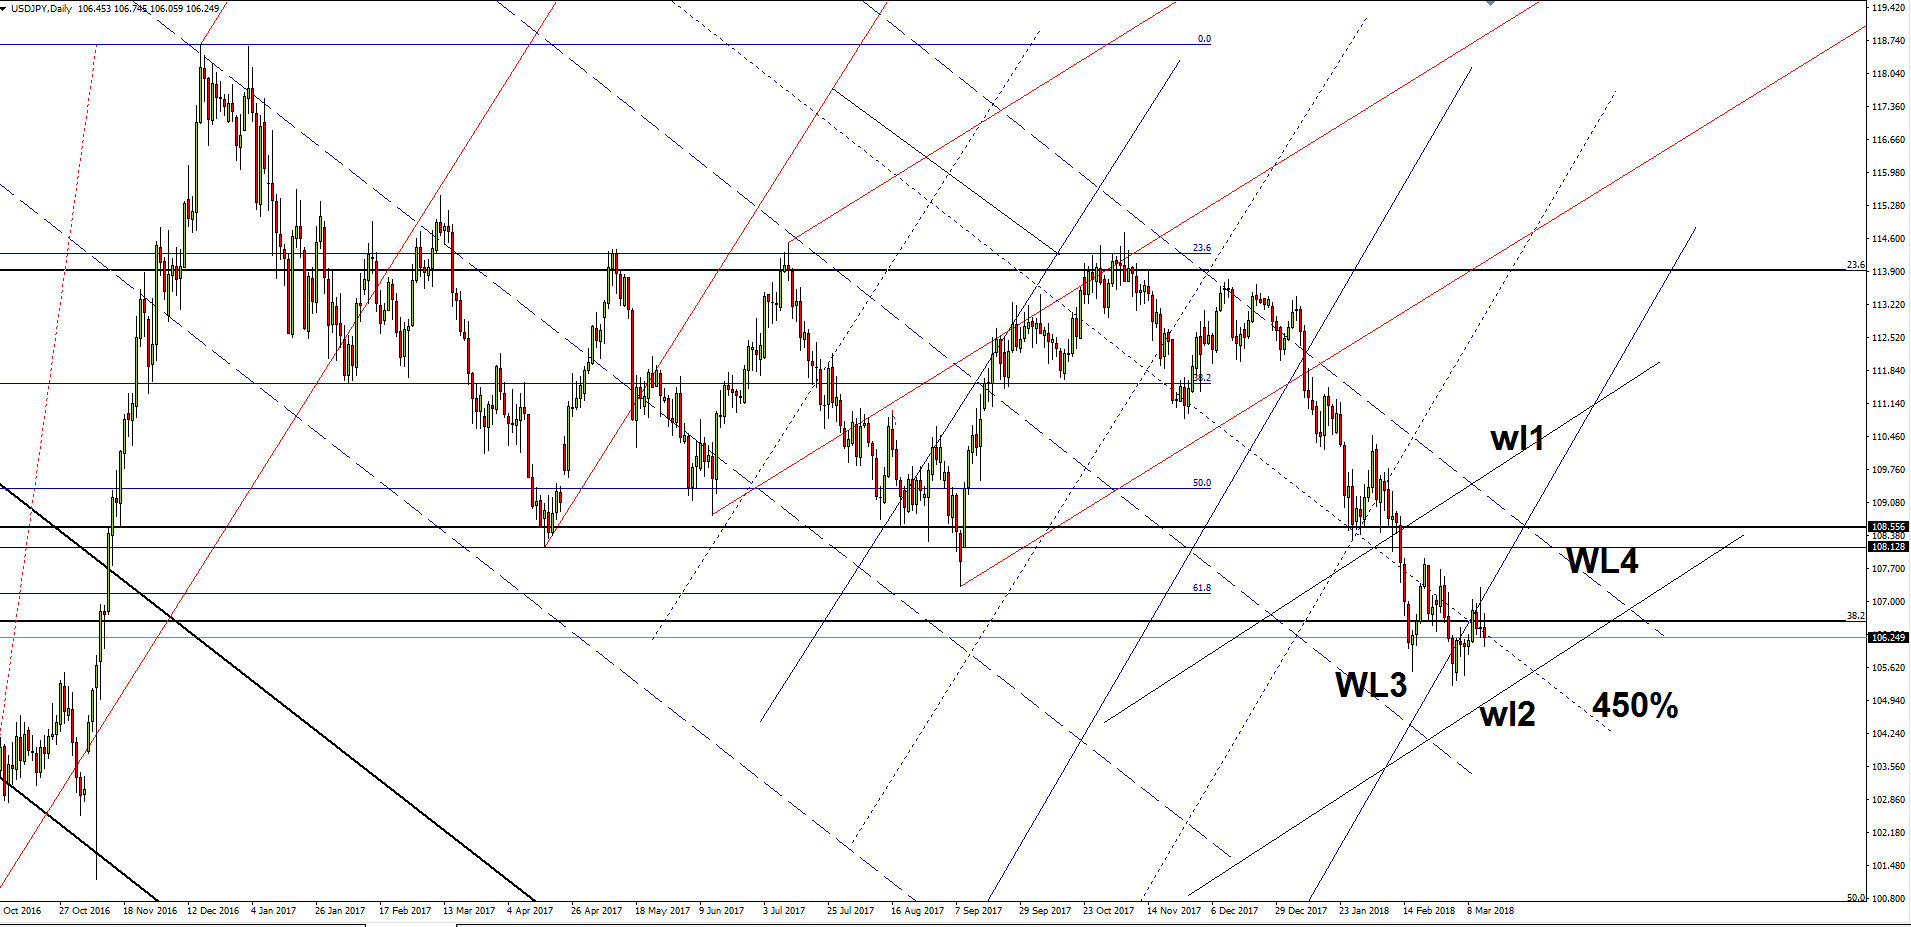
Price failed to stabilize above the 450% Fibonacci line (descending dotted line) and above the blue up sloping line and now could drop towards the second warning line (wl2) of the minor ascending pitchfork.
USD/JPY failed to stay above the long-term 38.2% Fibonacci level signaling an exhaustion and a potential drop.
I’ve said in the previous days that only a valid breakout above the fourth warning line (WL4) of the major descending pitchfork will confirm a broader rebound, till then the rate remains under selling pressure and could drop again.