
The USD/JPY currency pair on Friday continued to trade sideways at about 155.78 following the latest round of data. The currency pair appears to be trading within a consolidative pattern formation in the 60-minute chart.
The pair also continues to trade a few levels above the 100-hour moving average line. However, the currency pair appears to be closer to an upward breakout as the 14-hour RSI moves closer to overbought conditions.
USD/JPY Fundamentals Overview

From a fundamental perspective, the USD/JPY currency pair is trading at the back of a relatively busy period in both markets. On Friday, the preliminary Michigan Consumer Sentiment Index for May missed the expected reading of 76 with a reading of 67.4, down from 77.2 in the preceding update. The preliminary UoM 5-year inflation expectations for the month improved slightly to 3.1% up from 3%.
On Thursday, the US initial jobless claims for the week ending May 3 fell short of the forecasted claim count of 210k with a tally of 231k, while the continuing claims for the preceding week beat 1.79 million with 1.785 million.
In Japan, the Eco Watchers Survey or current situation in April missed the expectation of 50.4 with a reading of 47.4. On Thursday, the seasonally adjusted current account balance for April missed the expectation of 3,48.6 billion yen with a balance of 3,398.8 billion yen.
Earlier in the week, labour cash earnings for March grew by 0.6% compared to a growth rate of 1.4% in the previous period, while foreign reserves edged slightly lower to $1.279 billion down from $1.290.6 billion.
USD/JPY Technical Analysis (the 60-min Chart)
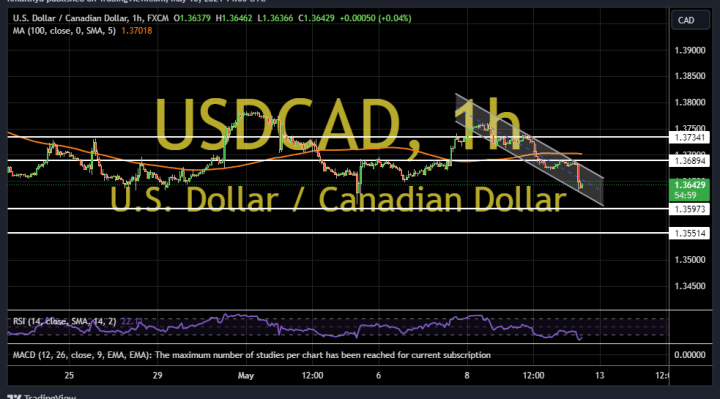
Technically, the USD/JPY currency pair appears to be trading within a sideways channel formation in the 60-minute chart. However, the 14-hour RSI seems to be attempting an upward breakout into overbought conditions.
Therefore, the bulls will be targeting potential breakout profits at about 156.93 or higher at 157.94. On the other hand, the bears will look to pounce on pullbacks at about 154.79 or lower at 153.78.
USD/JPY Technical Analysis (the Daily Chart)
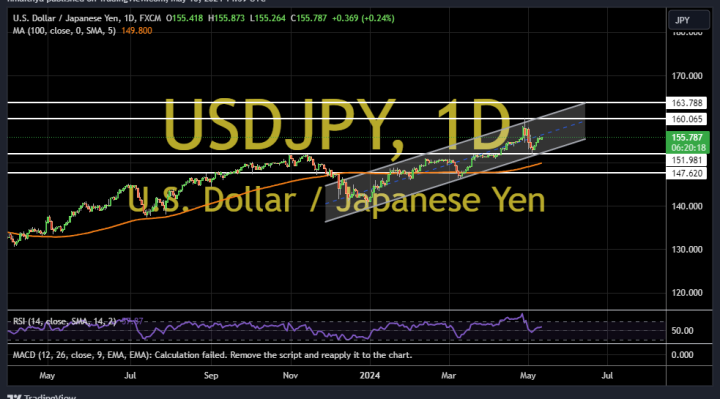
In the daily chart, the USD/JPY currency pair appears to be trading within an ascending channel formation. However, the 14-day RSI has recently pulled back to recover from overbought conditions.
Therefore, the bears will be targeting extended pullback profits at about 151.98 or lower at 147.62. On the other hand, the bulls will be targeting long-term profits at about 160.06 or higher at 163.78.