
The USD/JPY currency pair pulled back on Friday afternoon to trade at around 106.650 after the US non-farm payrolls missed expectations of 158k with 130k jobs for August. The currency pair had rallied to top 107.260 on Thursday ahead of the big day in the US labor market.
The currency pair continues to trade in an upward trending channel, which indicates a short-term bullish bias despite today’s pullback. The pair still remains above the key resistance zone now turned support at 106.815 following a bullish breakout earlier this week.
USD/JPY Fundamentals Overview

From a fundamental perspective, today’s US economic data followed in the footsteps the events of the last few days with the market again posting mixed data. The US nonfarm payrolls for August came in at 130k missing the expectations of 158k and down from the previous month’s reported figure of 164k.
The average hourly wage growth was solid on a month-over-month basis beating expectations of 0.3% growth with 0.4% while the yearly counterpart posted a 3.2% growth versus an expectation of 3.1%.
The unemployment rate was steady and in line with expectations at 3.7% while the labor force participation rate edged higher to 63.2% up from 63% in the previous month. Today’s data is very similar to the vents of the last few days during which the ISM Manufacturing PMI missed expectations of 51.0 with 49.1 while the Non-Manufacturing PMI impressively beat with 56.4 versus an expectation of 54.0.
USD/JPY Technical Analysis (the 60-min Chart)
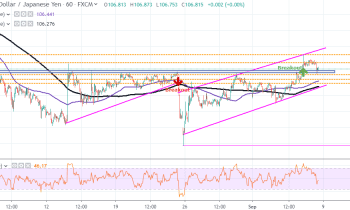
Technically the USD/JPY currency pair appears to be trading in an ascending channel, which implies a short-term bullish bias. The pair has recently surged above a key resistance zone at 106.800, which has now turned into a strong support level.
Going into the weekend, traders will be looking to pounce on opportunities at around 107.015 and 107.263 (bulls) and 106.681, 106.486 and 106.370 (bears). The relative strength index indicator suggests that the current trend could continue through next week since it is far from hitting overbought levels in the 60-min chart.
USD/JPY Technical Analysis (the Daily Chart)
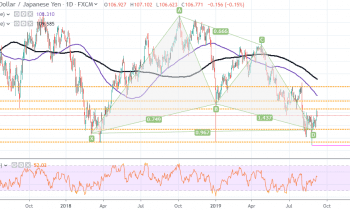
In the daily chart, the USD/JPY currency pair appears to have recently completed the formation of a bearish XABCD pattern. The pair now appears to be attempting a rebound after four consecutive months of declines.
Therefore, the bulls will be targeting long-term profits at around 107.262, 107.881 and 109.000 going into next week. On the other hand, the bears will look to pounce on profits at around 106.677 or lower at 104.682.
In summary, the USD/JPY currency pair appears to be experiencing a short-term bullish bias but in the long-term, the bears retain control.