
USDCAD could be in for a reversal from its uptrend as price is forming a head and shoulders pattern on its 4-hour chart. Price is about to break the neckline around 1.3150, which could set off a slide that’s the same height as the chart formation.
The 100 SMA is above the 200 SMA to indicate that the path of least resistance is to the upside. In other words, support is more likely to hold than to break. Then again, the gap between the indicators is narrowing to reflect weakening bullish momentum and a potential bearish crossover.

RSI is already indicating oversold conditions, though, which means that sellers are already exhausted. Stochastic is heading lower to indicate that selling pressure is in play, but the oscillator is already in the oversold region to signal exhaustion as well. Turning higher could show that buyers are back in the game.
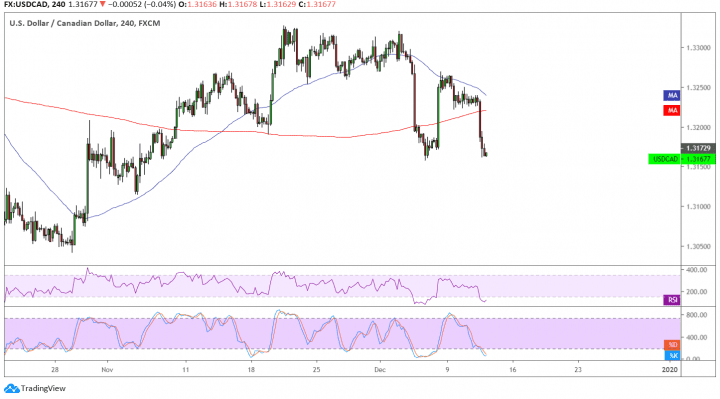
Still, the chart pattern spans 1.3150 to around 1.3350 so the resulting slide could be of at least 200 pips.
The US dollar was under pressure after the FOMC decision as the central bank kept rates on hold as expected but seemed more dovish. Policymakers shared a bleak inflation outlook, which supports the idea of further rate cuts down the line in order to keep price levels stable.
BOC Governor Poloz has a speech coming up later in the week so Loonie traders could take their cues from his testimony. Crude oil has been on weak footing on account of trade tensions between the US and China, especially since the deadline for the next set of tariffs is fast-approaching. Worsening tensions could mean more levies on crude oil, which might then drag the correlated Loonie south.