
VZ Long-term outlook
Verizon (NYSE: VZ) recently upgraded by Well’s Fargo (NYSE: WFC) from “Market Perform” to “Outperform.” Despite the upgrade, VZ share prices have declined from $53.96 to $46.30 or nearly 15% this year. The stock performance is worse and could turn worst. Overall, the company revenue was up, but revenue from its main business wireless declined 2.4% quarterly.
However, if Well’s Fargo analyst right, the company might turnaround its revenue in wireless next year. Moreover, the company investment in fiber technology should provide cost-saving in the future. Well’s Fargo assigned a target price of $50.00 for VZ share prices.
New Month
Monthly chart

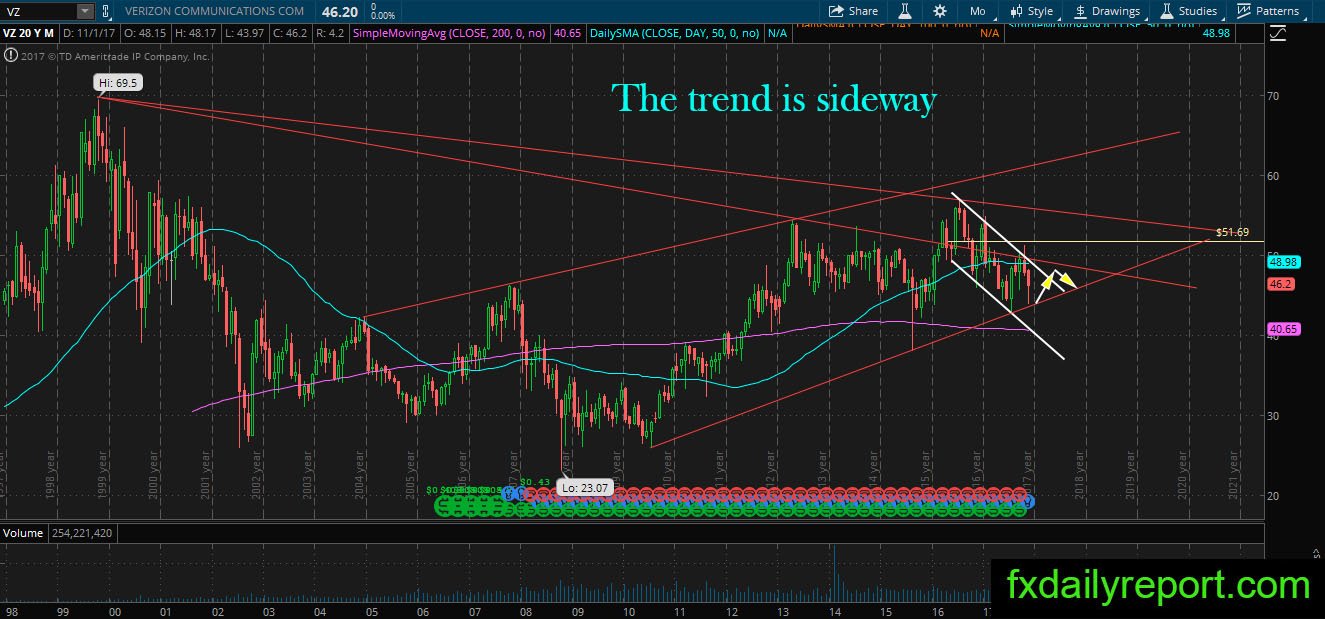
VZ show initial bounce from lower trendline on the monthly chart. Overall, the trend is sideways for share prices movement. The bounce from bottom trendline will head higher to test the upper trendline which tested in the previous month.
Weekly chart

The weekly chart shows a bearish trend where VZ move down inside the white bearish channel. There was a bounce from the red trendline, and it looks like VZ will target the top of the channel and a cluster of averages. Traders could trade the range formed between the top of the channel and the trendline until one of them broken.
Daily chart
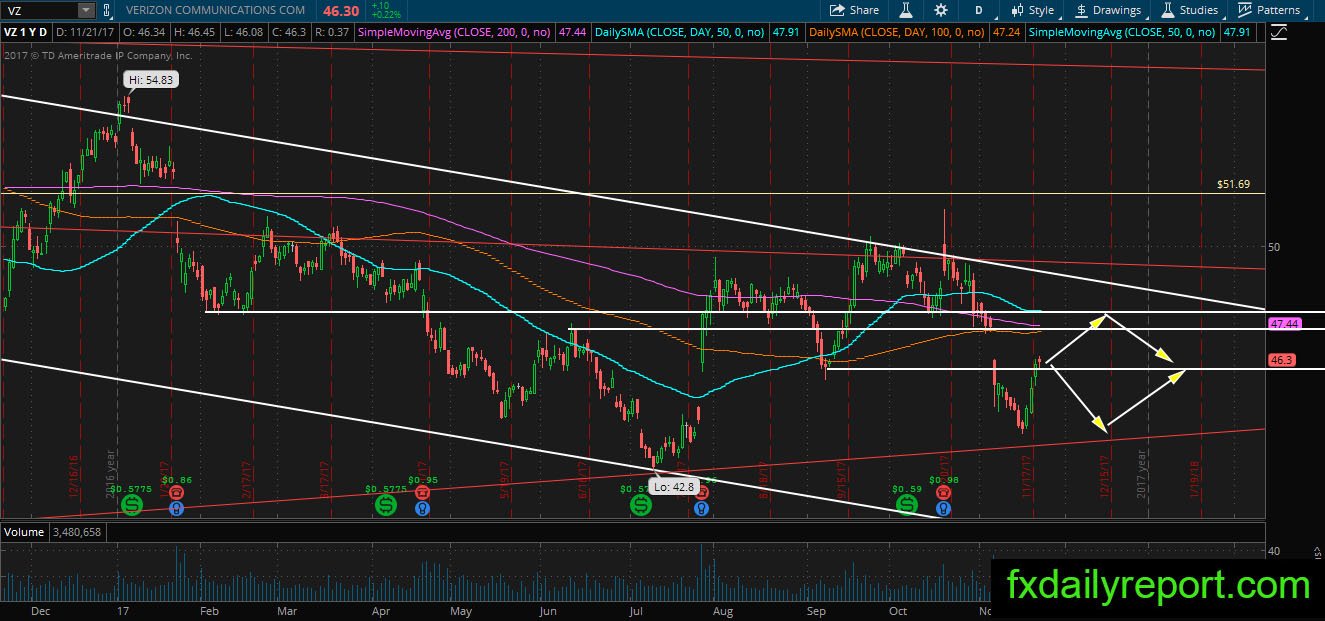
VZ nearest resistance located around $46.00 – $46.30 where the share prices move currently. There is a potential upward movement toward next resistance at $47.00 – $47.50 where there is daily SMA 50 & 100. Traders could look for short positions when share prices hit next resistance area.
Trade plan
Bullish position needs to wait until the break above $46.00 – $46.30 area on the daily chart.
The bearish position could be taken from $47.00 – $47.50 area on the daily chart or higher at the top of the white channel.