
V Long-term outlook
If you want to see a company which increases their share prices ten times in just eight years, you can bet on Visa (NYSE: V). The share prices have increased from $10.45 2009 bottom to $110.74 in 2017 and showing no sign of slowing down. It means if one invest roughly $10,000 in Visa, he/she could cash out $100,000 in 2017. Using this method only, traders could trade better than Warren buffet which has 30% annual return.

Under modern world which shifts from cash transaction to cashless, there is much room for the company such as Visa to grow. However, the company could not rest as Cryptocurrency riding on a high wave. The shift to cashless also produces negative side effect from privacy & security side. If Visa could answer the problem and provide more safety & flexibility on payment, it will take a long time for competitors to shake the company.
For the shares: Unfortunately, without any shakeout in Visa shares, traders might have a hard time to pinpoint where to buy the company shares.
Technical Analysis
Monthly chart
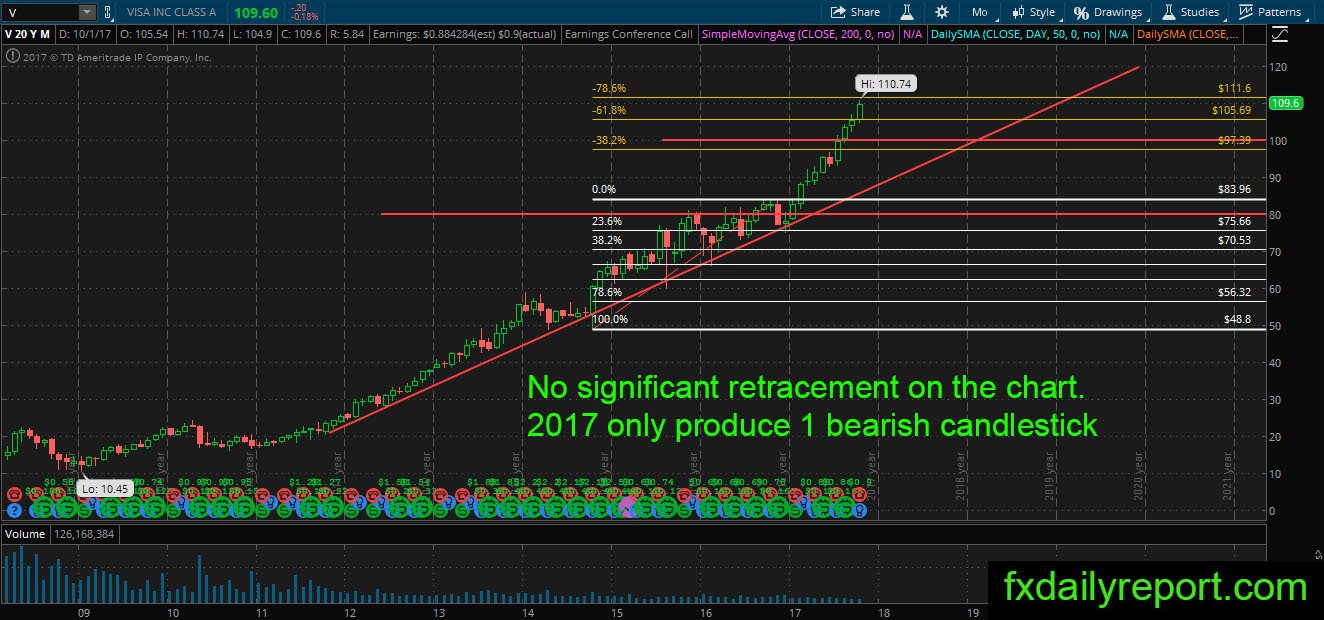
From the first look at V monthly chart, traders could know there is no room for the bear. The price is running up without a stop in 2017, and there is only one bearish candlestick printed on the chart. Mapping out the movement, the share prices currently hovering just below 78.6% extension. Will it stall and reverse in the fourth quarter of 2017?
Weekly chart
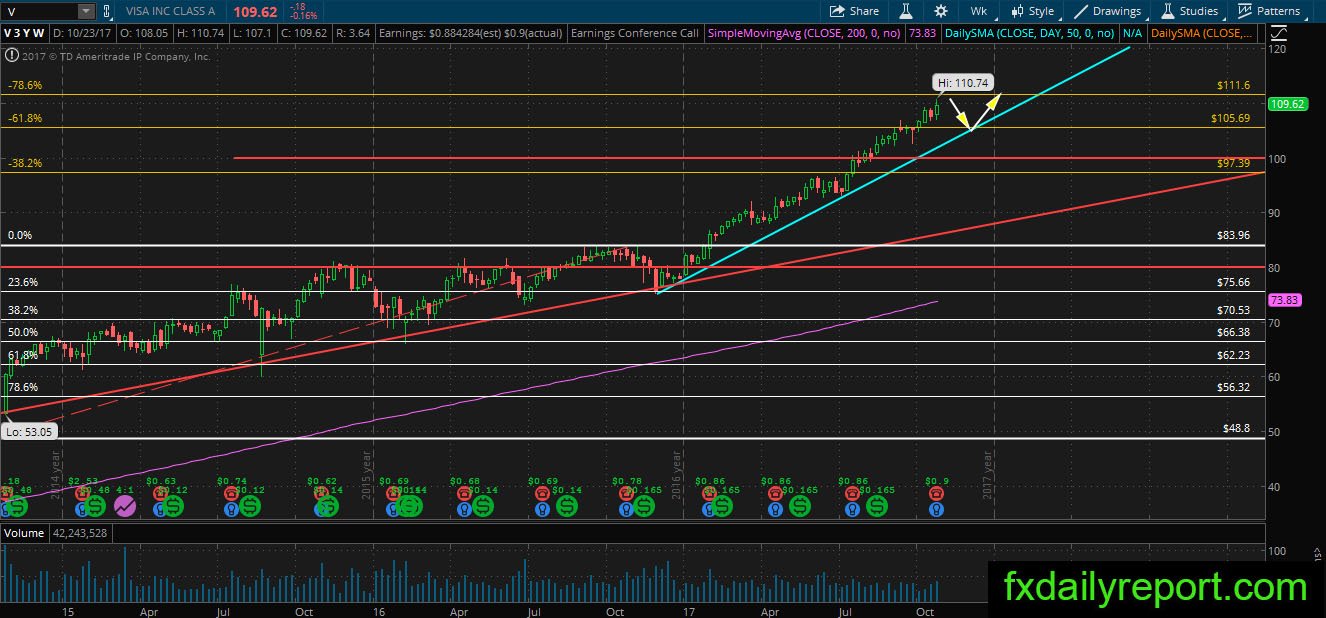
Similar outlook to the monthly chart, V on the weekly chart possible to reverse after it reaches 78.6% Fibonacci Extension and fall to the blue trendline. If the share prices fall below the blue trendline, it has $100 as a major support level.
Daily chart
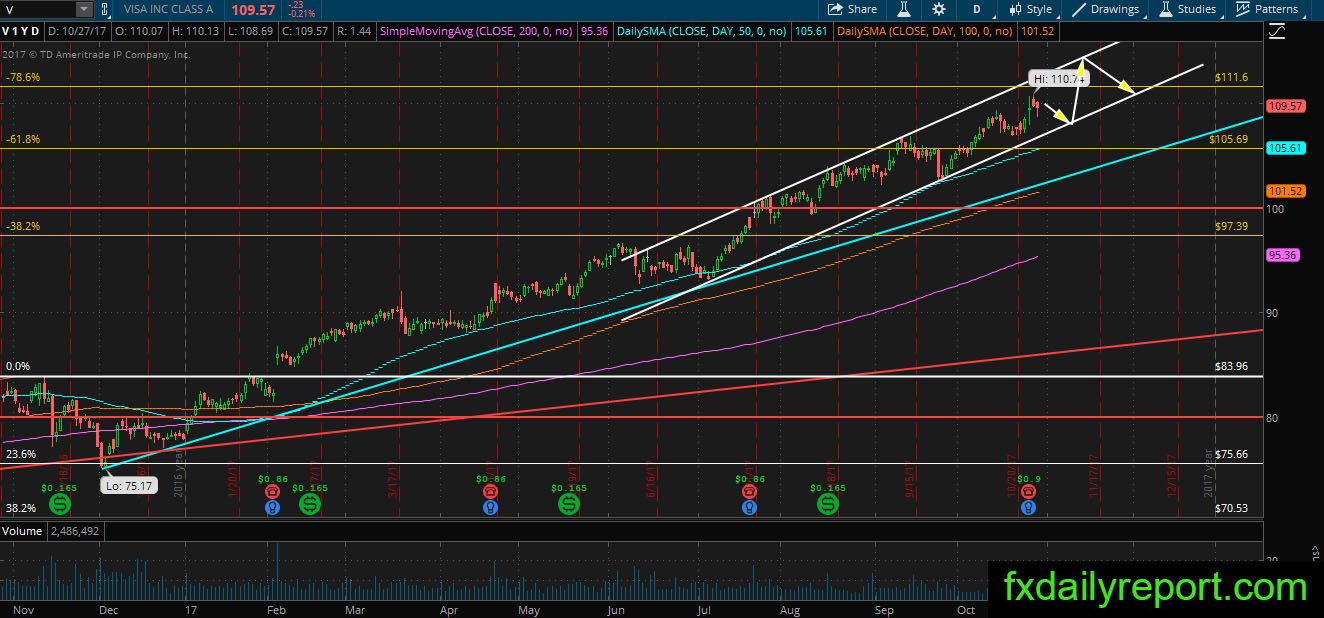
The daily chart of V also bullish with the white channel as price movement projection. Traders could look for short-term long position near the bottom of the white channel.
Trade plan
Bullish position: Short-term position could be taken near the bottom of the white channel on daily chart. Traders could look for medium-long term position near blue trendline on weekly chart and $100 handle.
Bearish position: Although there is Fibonacci Extension 78.6% as the resistance level, it is better for traders to look only long position. There is no guarantee short position will work under extreme bullish condition.