
WMT Long-term outlook
Doom and gloom in retail sector continue shadowed U.S retails storefronts. Fortunately for Walmart (NYSE: WMT), the spending spree done in recent years show a little ray of light. Though it is not certain yet, the company rebuild its position as largest brick and mortar retailer. The rebuilding might be insignificant to the Amazon market share, but it poses a threat to other retailers.
Recently, Walmart cut prices on its several major business units. The company understands it needs to offer more efficient and cheaper price to compete with online retailers. While the slight ray of hope present, the threat also real as the company needs to cut prices to compete with other online businesses.

Click here to see WMT March analysis
New Month
Monthly chart
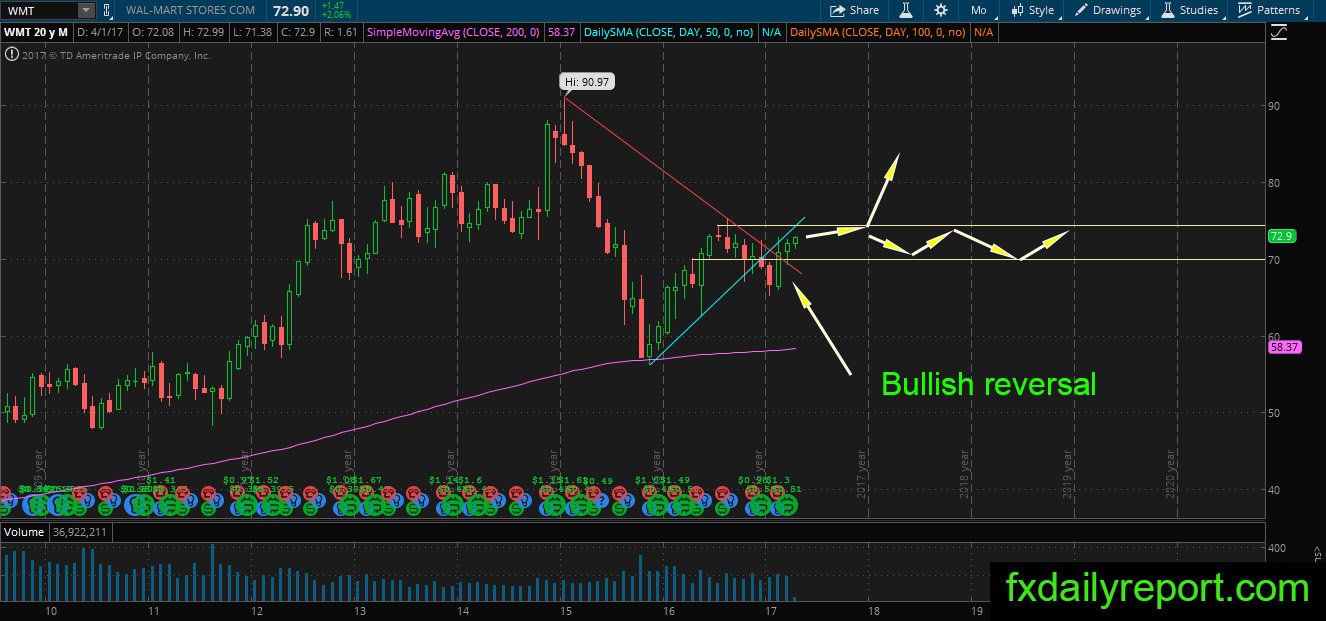
The bullish reversal in February put WMT back into bullish trend, but it looks like the reversal will be short-lived. There is resistance around $74 – $75 which the bull need to overcome. If the price failed to break upside, it might consolidate between $70 – $75 before deciding on next direction.
Weekly chart
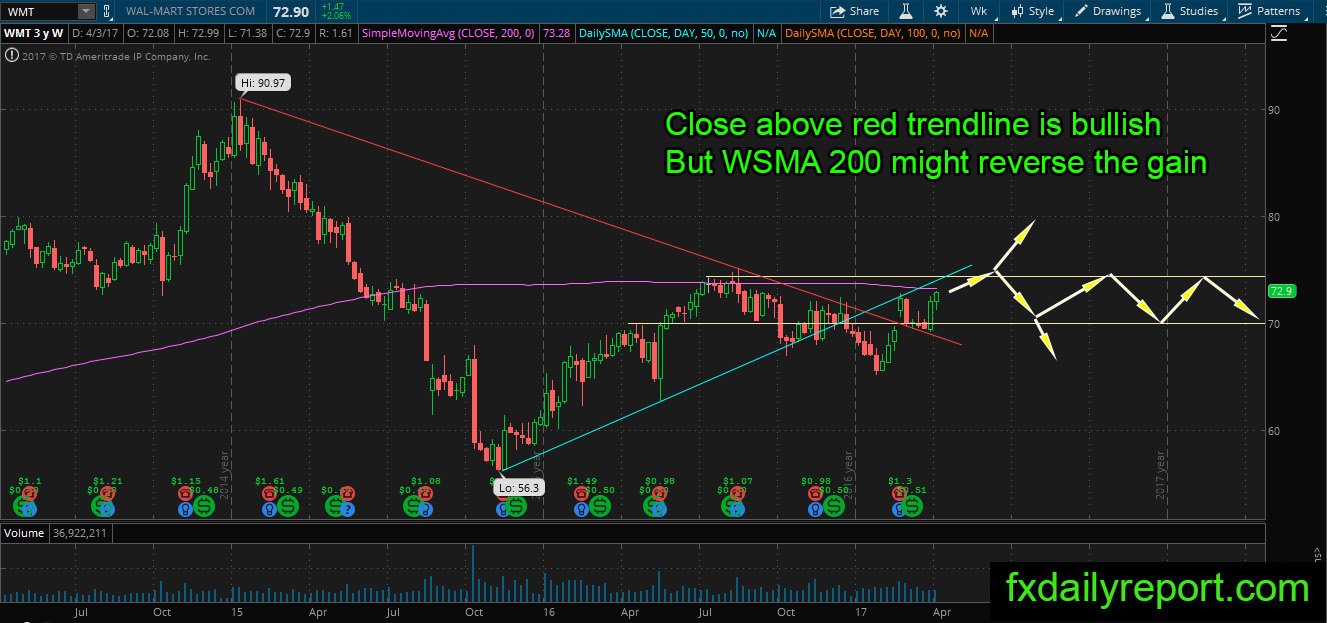
A bullish outlook on WMT weekly chart after the price bounced from the red trendline. The gain in WMT shares might reverse its course after it touched the WSMA 200. Traders need to observe the formation of candlestick near the resistance before placing any position.
Daily chart
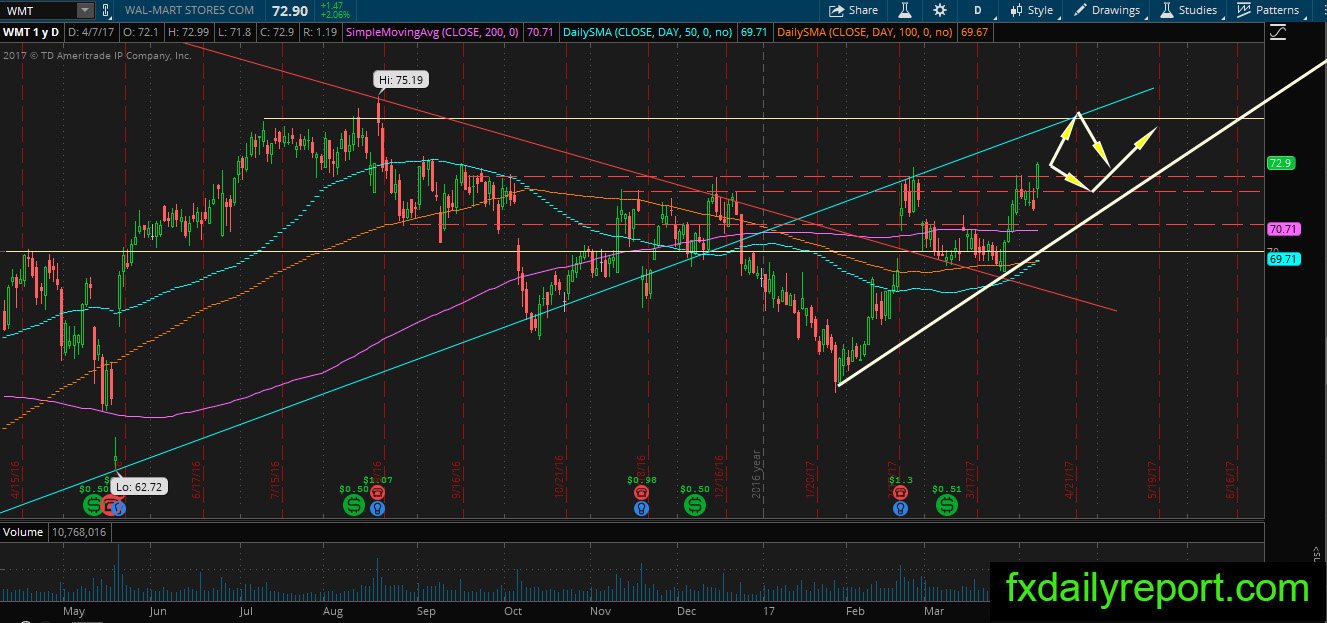
The daily chart shows a break above $72 – $72.50 resistance area after upgrade given by Telsey Advisory Group. The break above resistance area is positive for WMT and might progress further upside either after test of $72.00 – $72.50 area or without it.
Trade plan
The long position best taken after successful re-test of $72.00 – $72.50 area.
The short position needs to wait until bearish formation formed near $72.00 – $72.50 or $74.50.