
DIS Long-term outlook
Bullish outlook in DIS continues to surprise the market with share price advance. There was an upgrade of rating by Guggenheim In March from “Neutral” to “Buy.” This upgrade put the shares up from $110.09 to $113.39. The company expected to benefit from tax reform which is the reason most media company shares up since Trump elected as President of United States.
Though this benefit is seen as a short-term trend which could span for six months. In the long-term period, analysts think the bear will win the battle started 12-16 months later. Meanwhile, the shares of Disney hit 12-month high and might continue upward.

Click here to see DIS March analysis
New Month
Monthly chart
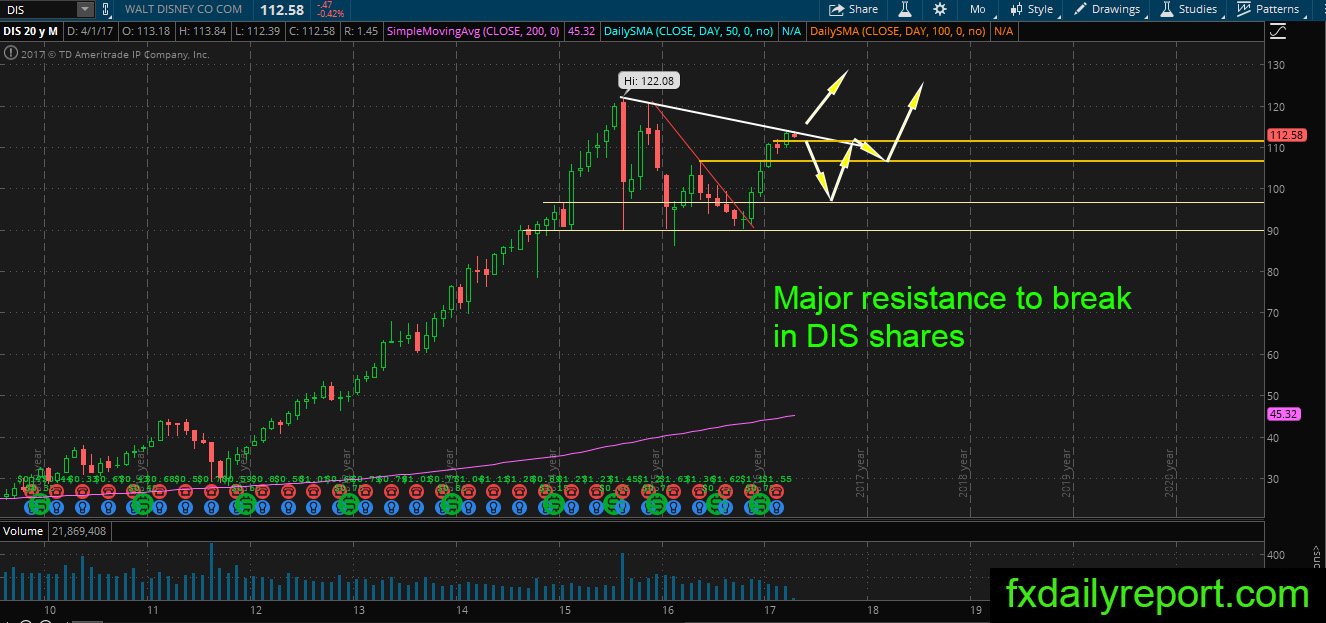
The trendline resistance on the monthly chart is the biggest obstacle DIS need to remove. Strong data come out from U.S also supported the share to continue higher, but traders still need to be wary. If the trendline is broken, $120 is the nearest resistance followed by all-time high $122.08.
Weekly chart
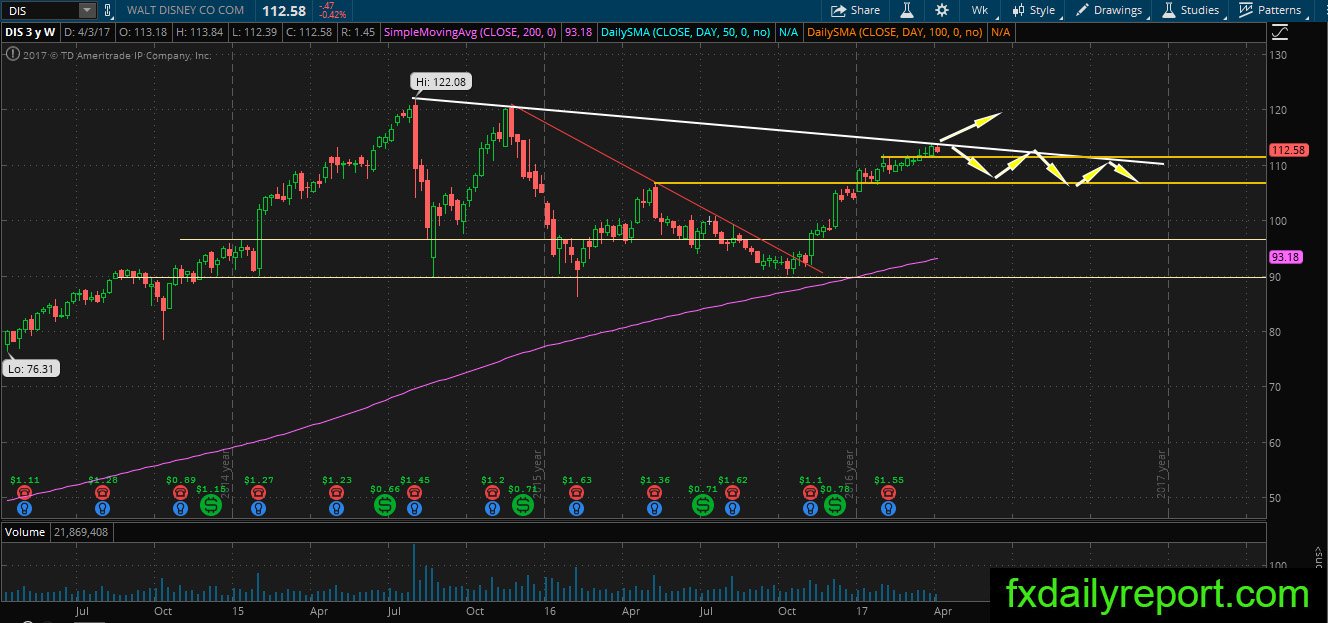
Not much to write about DIS weekly chart as the price move similar to the monthly chart. The trendline resistance is the level to watch, and on the lower side, the level around $106.00 is the support level to watch. There is a possibility the price will move between $106.00 – $113.00 in April.
Daily chart
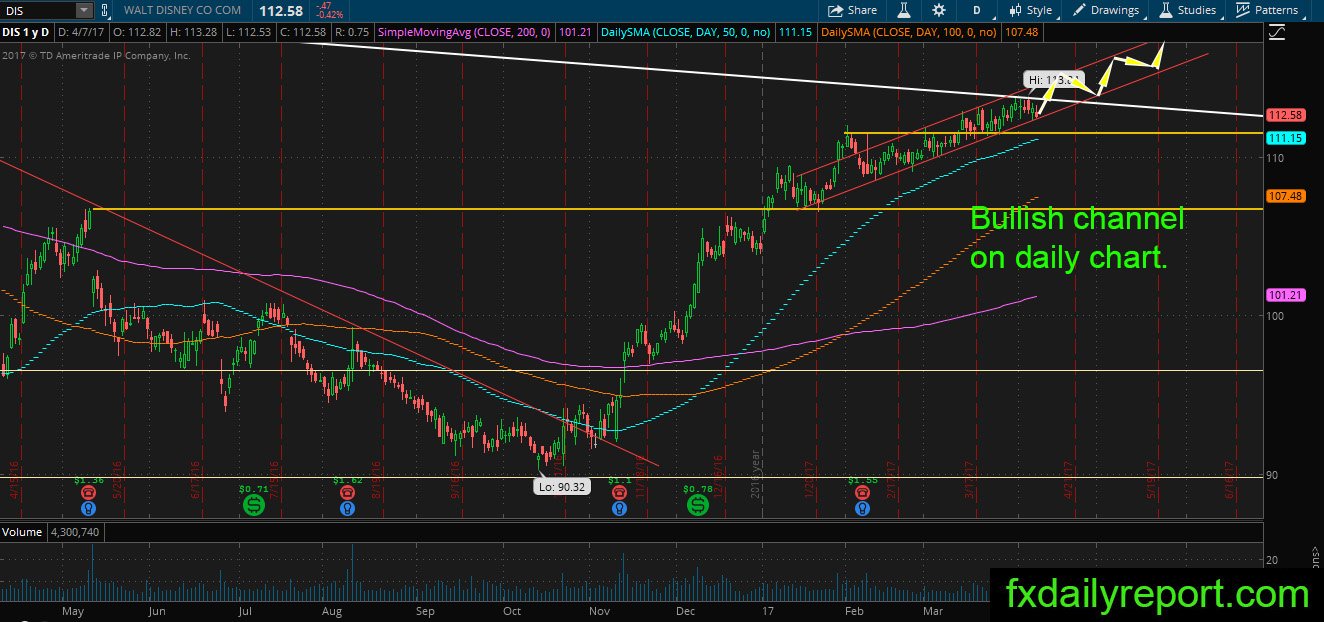
Extremely bullish outlook in the daily chart as the price is moving inside the bullish channel. It is slowly moving higher and might continue above the white trendline. A reversal might happen if the price manages to close below the bullish channel which is low odds.
Trade plan
The bullish position could be taken when the price reaches bottom of the daily channel with a tight stop loss order.
The bearish position could be taken from the white bearish trendline, but the odds it will work long-term is low which is not encouraged.