
DIS Long-term outlook
The bullishness of Walt Disney continues in January 2017 as December performance has been extraordinary as the shares gained from $99.13 to $104.22. Recently Goldman Sachs analyst Drew Borst upgraded the outlook for DIS from neutral to buy and raise target price from $109 to $134.
This upgrade come under four consideration:
- Best movie slate in fiscal 2018
- Diminishing pressure from ESPN
- Opening of New theme park in 2019
- Benefit from tax reform

Though upgrade and also positive outlook, a short while ago Pivotal research group downgraded its outlook from “hold” to “sell” and decrease target to $85 from $102. It was the second time this group downgraded outlook in DIS. Fortunately, the downgrade mostly come out from the ESPN subscription factor, as long as the company decides to spin-off the division in the future, the outlook should improve.
Click here to see DIS December analysis
New Month
Monthly chart
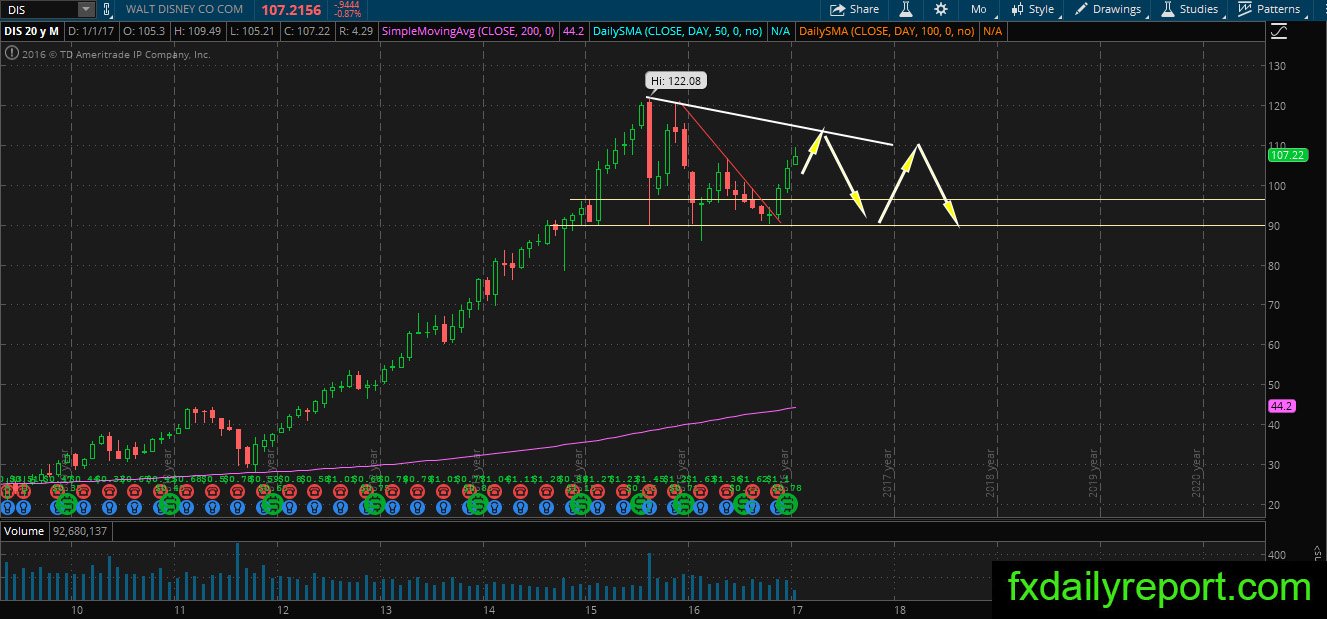
The path is clear for DIS shares, its upward and toward the white trendline. The price might touch the trendline at $115 before reversing its direction. On the lower side, $90 – $97.5 still play as significant support.
Weekly chart
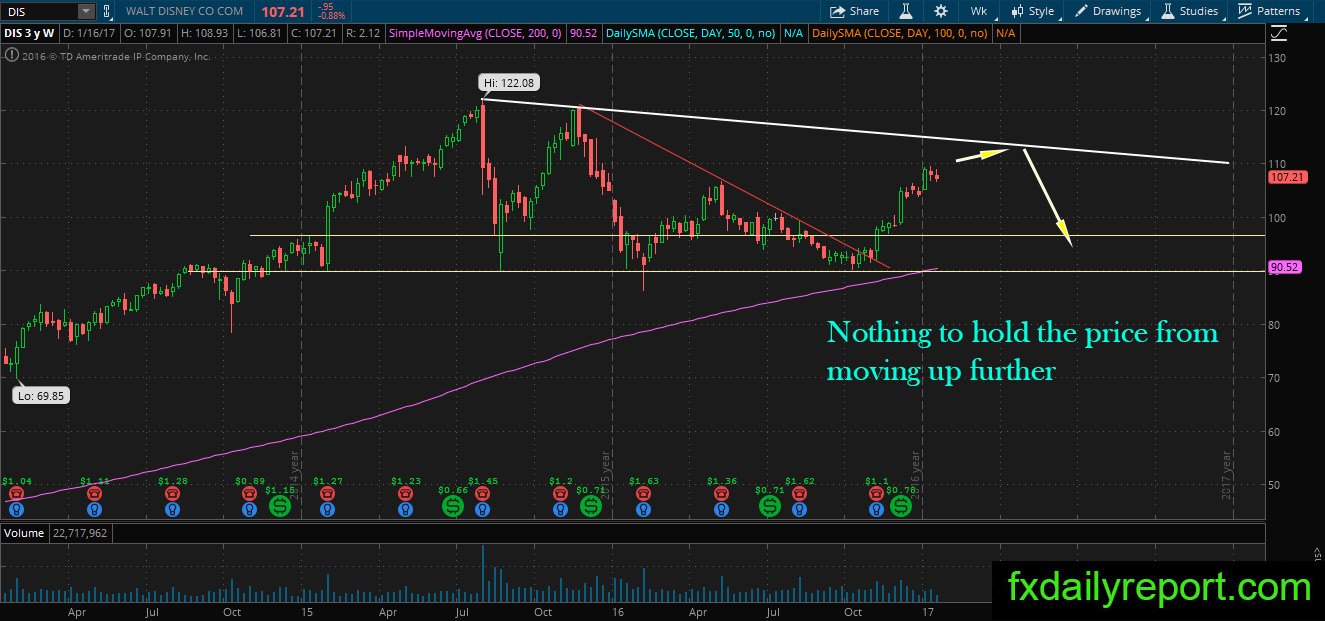
No significant resistance between the price and the nearest trendline. Similar to the monthly chart, DIS in the weekly chart show domination of bull. The bearish trader might want to observe how the price reacted when it reached the trendline. Best suggestion for traders is waiting until the trendline broken and find an opportunity for the long position after the successful retest of the trend line.
Daily chart
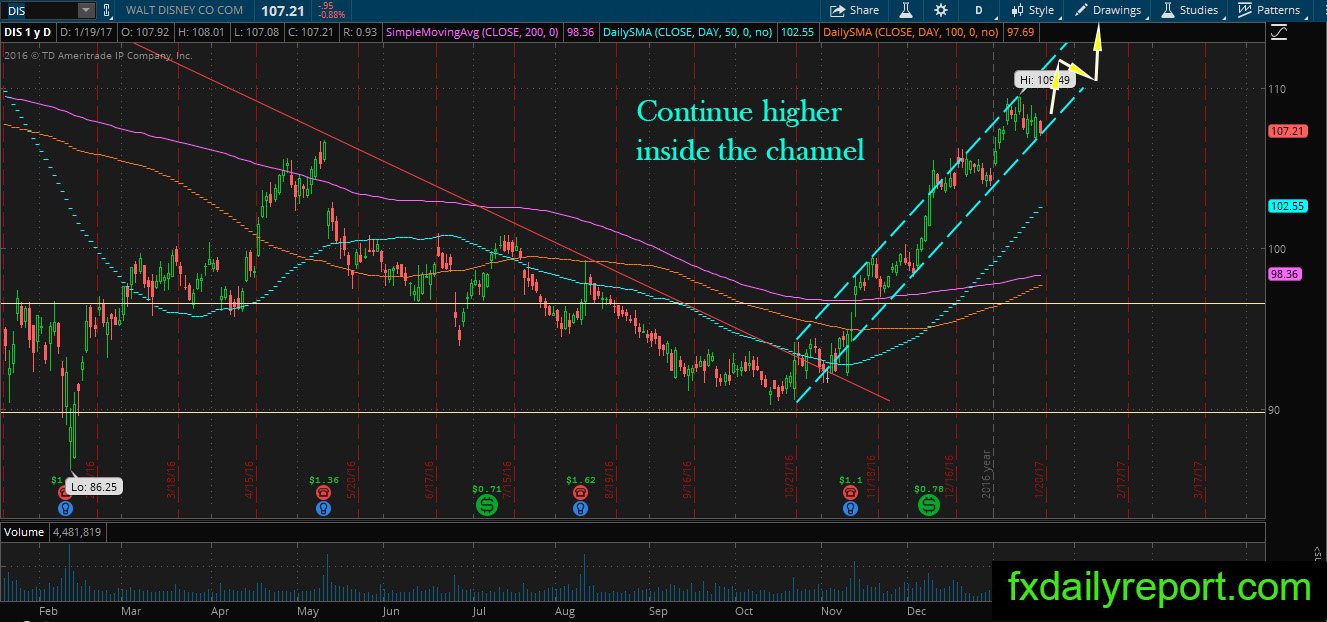
The most bullish chart of DIS is the daily chart. We can see the price shooting upward inside the bullish channel. Traders could easily profit just from buying all retrace toward the lower part of the channel. Bearish trade is not encouraged as it is easier to profit from the long position rather than short position.
Trade plan
Bullish position bests taken on daily chart when the price retrace toward the bottom of the channel.
The bearish position is not encouraged, but traders can observe how price reacted near the white trendline showed on the monthly chart.